| < Previous page | Next page > |
Tributary Confluence EffectsTributary Confluence Effects (Probability)
Parameter Description: The probability (0-1) that a tributary will have a geomorphic effect in the channel that it enters, including via it’s alluvial or debris fan. The predicted probability is based on Benda et al. 2004b (and see Benda et al. 2004a and Benda et al. 2008). The probability value is mapped across a length of stream that corresponds to a prediction of length of confluence effects (see Figure 2b) and it varies from the full P value at the point in the mainstem closest to the tributary intersection and goes to zero at the maximum length of the effect.
Data Type: Points (tribs_) and Lines (stream layer)
Field Name: p_trib Common name: Confluence effects probability (reaches)
Field Name: EffectProb; Common name: Confluence effects probability (tributary points)
Associated Attributes
Field Name: PatchSize; Common name: Length of confluence effects (m)
Field Name: MainArea; Common name: Drainage area of mainstem river (tributary points)
Field Name: TribArea; Common name: Drainage area of tributary river (tributary points)
Field Name: MainGrad; Common name: Gradient at confluence - Mainstem
Field Name: TribGrad; Common name: Gradient at confluence - Tributary
Units: Probability, 0-1
Length (m)
Area (km2)
Gradient (L/L)
NetMap Module/Tool: Fluvial Processes/Network Variables
Model Description (Data as Reach Attributes and as Points at Junctions):
Confluence related effects at, and near junctions, result in creation of terraces and wide floodplains (Small 1973, Grant and Swanson 1995, Schmidt and Rubin 1995), formation of channel meanders and braids (Benda 1990; Church 1983), changes in bed substrate (Rice et al. 2001, Bigelow et al. 2007) including creating boulder deposits and rapids (Wohl and Pearthree 1991, Meyer et al. 2001), deeper and wider channels (Best 1986; Benda et al. in press), mid-channel bars (Best 1986), ponds (Everest and Meehan 1981), and log jams (Hogan et al. 1998) (Table 1). Morphological effects of junctions are most pronounced in lower-gradient portions of rivers and may decline in steep, narrow valleys where high stream energy quickly erodes fans or in wide valley floors where fans are isolated from mainstem rivers (Benda et al. in 2004a,b).
Confluence probability is based on logistic regression equations in Benda et al. 2004b and also described in Benda et al. 2004a. Confluence probability is included as a standard NetMap parameter and a stand-alone model is not required. Empirical data from 14 studies in North America (Table 1) documenting effects of tributaries on river morphology at 168 confluences spanning 6 orders of magnitude in drainage area were used to estimate the probability that a tributary will affect channel morphology, given any mainstem drainage area. The data were binned by symmetry ratio and a logistic regression used to describe the proportion of tributaries having effects within each bin. The logistic model specifies the probability that a tributary will have an effect as:
Pe = exp(g(x))/(1 + exp(g(x))) (1)
where Pe is the probability that a tributary will affect the morphology of a mainstem river and g(x) is fitted to the data (see data in Benda et al. 2004b) (Figure 1). Effects in mainstem channels are defined very generally as those listed in Table 1 and are not differentiated according to type or magnitude.
Using for humid environments, the regression is:
g(x) = 3.79 + 1.96*log(ta/ma) (2)
where ta/ma is the ratio of tributary-to-mainstem drainage area (i.e., symmetry ratio) (Figure 1). Based on this equation, there is an 85% probability that tributaries with drainage areas 1/10 that of the mainstem will create an observable effect. The probability decreases to less than 10% for tributary basins less than 1/1000 (0.001) the size of the mainstem.
A logistic regression was also made using the data from semi-arid areas:
g(x) = 0.96 + 1.47*log(ta/ma) (3)
Table 1. Studies that have documented tributary junction effects in non-regulated and regulated (dammed) rivers across the western U. S. and Canada are arrayed according to increasing drainage area.
Effects: (A) Gradient steeping; (B) Gradient lowering; (C) Upstream sediment deposition; (D) Changing substrate size; (E) Boulders –rapids; (F) Terraces; (G) Floodplains; (H) Side channels; (I) Mid channel bars; (J) Ponds; (K) Log jams; (L) Meanders, and (M) Channel instability.
A Indicates the number of confluence effects in study
B Indicates the length of the river surveyed in studies detecting more than one confluence effect.
References
1 Benda et al. 2003a
2 Wohl and Pearthree 1991
3 Hogan et al. 1998
4 Everest and Meehan 1981; Benda 1990
5 Benda et al. 2003b
6 Grant and Swanson 1995
7 Grimm et al. 1995
8 Baxter 2001
9 Rice et al. 2001
10 Meyer and Pierce 2003
11 Church 1983
12 Meyer and Liedecker 1999
13 Mellis et al. 1995
14 Booth et al. 1991
The regression for semi-arid areas is more skewed, in part because of the lack of data at small mainstem drainage areas (i.e., < 100 km2), and attains a maximum of only 80%, in part due to the overlap between debris-flow/flash-flood and alluvial fans. This result suggests that a high proportion of tributaries in semi-arid climates are less likely to affect mainstem channels than those in more humid climates.
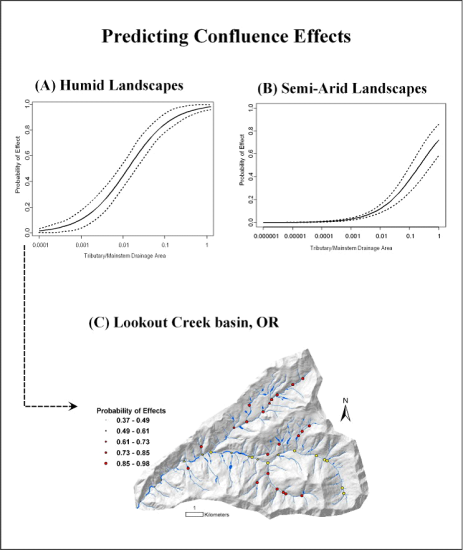 Figure 1. The probability of a tributary impacting the morphology of a mainstem river depends on the size of the tributary relative to the size of the mainstem. Data from 14 studies in western United States and Canada along 730 km of river encompassing seven orders of magnitude in drainage area (Table 1) were used to develop logistic regression equations for semi-arid and humid landscapes (A & B) (Benda et al. 2004,a,b). This model in NetMap is used to predict the likelihood of confluence effects (C). Other factors are important such as time since last fan-forming event (storms, fires, floods), the grain size of the transported sediment, and valley width. WThe probability of confluence effects for a given tributary – mainstem drainage area ratio is higher in humid environments compared to semi arid. This disparity may reflect differences in disturbance frequency and magnitude. In semi arid environments, disturbances (such as post fire gully erosion) may have an extreme magnitude but may occur relatively infrequently. Consequently, the age distribution of confluence effects may be skewed toward older age (see Benda et al. 2004).
A scaling property of confluence-related morphology is that the sizes of habitat patches associated with tributaries increase downstream (Benda et al. 2004). Although the data are sparse (Figure 2, B), the length of channels affected by confluences ranges from tens to a few hundreds of meters in basins less than approximately 100 km2 to several kilometers in basins between approximately 1,000 and 300,000 km2. This pattern is anticipated since channel gradient declines with increasing river size. Consequently, any vertical obstruction in a channel that causes sediment accumulations (e.g., fans, logjams, boulders) should influence a channel distance upstream at least equivalent to the obstruction height divided by the tangent of the underlying stream gradient. Model output is illustrated in Figure 2.
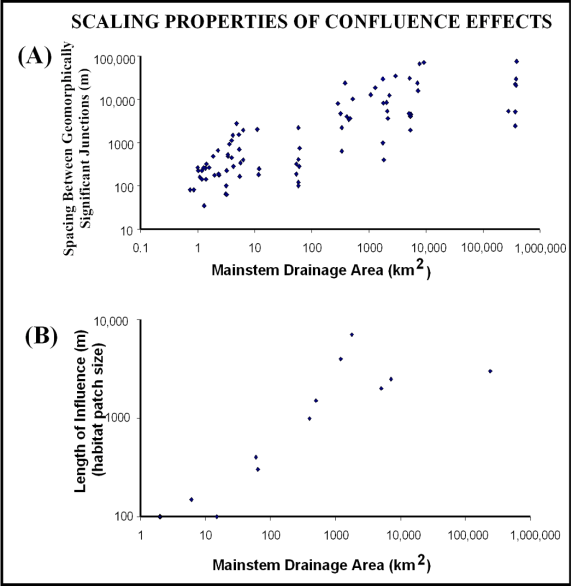 Figure 2. (A) The effect of basin size on the distance between tributary confluence effects is evident from field data obtained from 14 different studies across humid and semi-arid landscapes (Benda et al. 2004a). In upper networks, geomorphically significant confluences are separated by hundreds of meters but in larger rivers they are separated by tens of kilometers. (B) Because channel slope decreases downstream, the size (length) of morphological changes associated with tributary confluences increases downstream, from 100 m in upper networks to kilometer-long patches at basin sizes of
10,000 km2. NetMap contains a parameter that describes how the length of confluence environments may change downstream according to drainage area.
Model Description (continued)
In the reach attribute (Field Name: p_trib Common name: Confluence effects probability (reaches)), the length of the confluence effects is based on the logisitc regressions (Eqs 1-3) and it varies linearly from a maximum at the junction to zero at either end of the patch, which is centered on the junction. Closely spaced tributaries can have overlapping patches. To account for the effects of closely spaced tributaries, the probability of tributary effects in a mainstem pixel is calculated as:
Pe = 1 – P(1-Pi) (4)
where Pi is the probability of effects from the ith tributary, the product is over all tributaries with a patch length including the mainstem pixel, and Pe gives the combined probability of effects from any of the tributaries.
The probabilities calculated likely do not simply reflect a dichotomous “effect” or “no effect”, but rather pertains to the magnitude of morphological effects, observations made in the field and conditioned by the spatial scale of the environment. For instance, at the scale of an ant hill, the sizes of individual grains of sand create recognizable patterns. However, at the scale of a mountain range, ant hills fade from view and the size of individual peaks become apparent to an observer. This scale-dependent perception must work in rivers as well. In large rivers, an observer’s attention is drawn to tributary related features that create morphological effects of a scale similar to the river itself (i.e., large bars, meanders, terraces, etc.), while smaller effects (a few boulders at the base of a small tributary and a small patch of sediment) are ignored. The relative magnitude of morphological effects (i.e., noticeably large, imperceptivity small) predicted by the probability functions do not simply reflect a scale dependent perception, but rather has important physical and ecological ramifications. For example, large changes in hydraulic geometry, fans, bars, and terraces have large implications for sediment transport and deposition compared to small changes in morphology, and likewise larger riverine habitats provide a larger niche space and habitat persistence in the face of various disturbances.
Technical Background
The influence of tributaries on mainstem streams and rivers are well recognized, although not often quantified. Tributaries can deliver higher inputs of nutrients and invertebrates that have been shown to increase primary and secondary productivity in receiving streams at confluences (Kiffney and Richardson 2001, Wipfli and Gregovich 2002). Fish may use tributary mouths as thermal refugia (Scaarnecchia and Roper 2000) or as dispersal corridors that support higher species diversity (Osborne and Wiley 1992). Tributaries also alter the hydraulic geometry of receiving streams including width, depth, and bar size and occurrence (Best 1986, 1988, Roy and Woldenberg 1986), and they can alter the particle size distribution either coarsening or fining the channel bed (Rice et al. 2001). Variations in hyporheic exchange also commonly occur at confluences (Baxter and Hauer 2000).
On a somewhat larger morphological scale, topographic knick points in rivers associated with tributary fans and sediment mixing at tributary intersections result in a large variety of morphologic effects at and near confluences including terraces and wide floodplains, channel meanders and braids, changes in bed substrate including boulder deposits and rapids, deeper and wider channels, mid-channel bars, ponds, and log jams (Church 1983, Best 1986, Grant and Swanson 1995, Hogan et al. 1998, Rice et al. 2001, Benda et al. 2003) (Figure 3).
All of these nutrient, thermal, and morphological effects can contribute to habitat heterogeneity and hence tributary confluences can be biological hot spots (Benda et al. 2004,a). Consequently, the pattern of the channel network in terms of spacing and size of tributaries in a watershed should influence the non-uniform distribution of certain types of habitats and habitat heterogeneity linked to confluences (Figure 4). For example, geological or topographic constraints on the formation of tributary basins can lead to clumped distributions of intersecting tributaries and associated confluence-derived heterogeneity (Figure 4). Overall, morphological effects of confluences may tend to be most pronounced in lower-gradient portions of rivers and may decline in steep, narrow valleys where high stream energy quickly erodes fans, or in wide valley floors where fans are isolated from mainstem rivers. In addition, the erosion regime of a watershed, particularly if it is punctuated in time, may influence how tributary confluences affect mainstem channel morphology and this aspect is discussed in greater detail in the fourth domain of climate and disturbance.
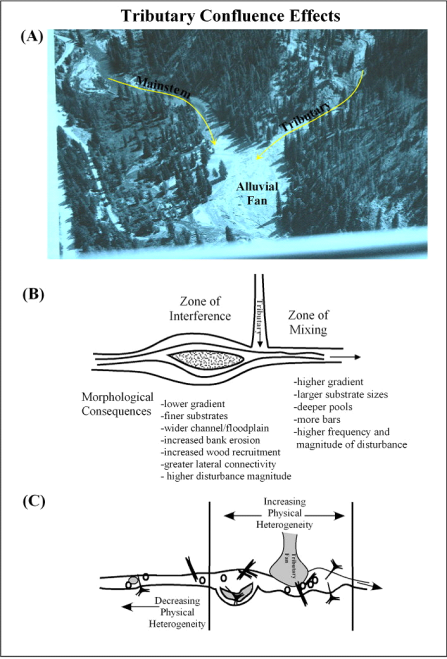 Figure 3. The potential influences of tributaries on receiving channels are numerous and include nutrient, thermal, chemical, hydrological, and morphological effects. Depicted here are sediment-related morphological effects that can occur at confluences both upstream (referred to as “interference”) and downstream (referred to as “mixing”). Consequently confluence areas can be zones of higher morphological heterogeneity, although punctuated disturbances cause such effects to wax and wane over time throughout river networks. Post fire erosion and sedimentation creates large fans and confluence effects as shown in the Sawtooth Mountains of Idaho (A). NetMap contains a tool for evaluating the potential for confluence effects.
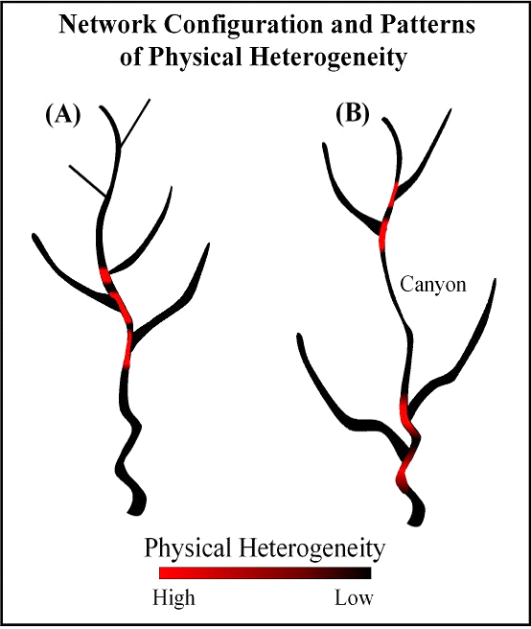 Figure 4. Variation in river network patterns should influence the spatial distribution of certain types of river morphology and habitats associated with tributary confluences. A convergence of many large tributaries should lead to a higher degree of morphological heterogeneity and other confluence effects (A) compared to channel segments devoid of larger tributaries (B).
The probability of observing confluence-related changes in the morphology of mainstem channels depends on the size of the tributary relative to the mainstem (Benda et al. 2004,a). Logistic regression equations are used in NetMap to predict the probability of confluence effects (Benda et al. 2004,b), a relationship that varies between humid and semi-arid landscapes (Figure 5). High confluence ratios (i.e., tributary drainage area/mainstem drainage area) indicate a high potential for various tributary confluence effects. Network maps display the spatial distribution of tributary confluences predicted to have a high potential of altering channel morphology and creating areas of potentially high biological value (Figure 5). Other factors can strongly influence the extent and magnitude of confluence effects including erosion processes, grain size of transported sediment (by debris flow, flash flood, and runoff floods), sedimentation characteristics of the receiving channel, and time since last fan-building event. Erosion and sedimentation parameters are included in NetMap. Other factors would need to be investigated in the field.
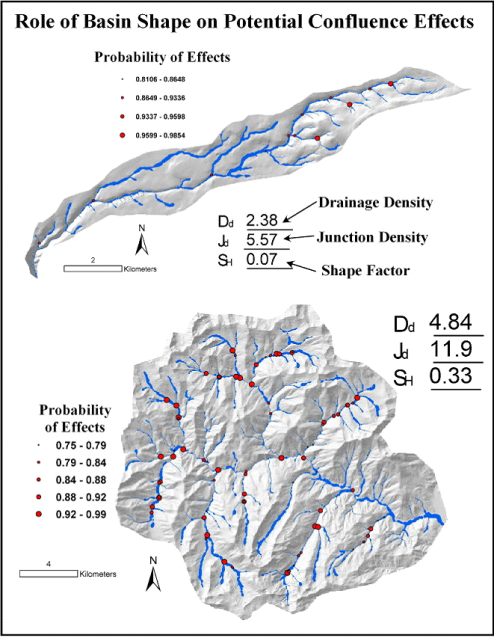 Figure 5. Basin shape (SH in the figure) strongly influences network configuration that in turn controls the spatial pattern of tributary size and their spatial relationship to receiving channels. Consequently, basin shape and network configuration should strongly influence the predicted probability of confluence effects and their spatial patterns in a watershed (Benda et al. 2004a). For example, narrow basins (top) are predicted to have fewer confluence effects compared to dendritic networks (bottom). In addition, drainage density that influences tributary junction density should also influence the number and likelihood of encountering confluence effects in watersheds
Use and Interpretation
Channel network configuration (i.e., trellis versus dendritic) will strongly influence channel network patterns and the spatial pattern of predicted confluence effects. Network configuration is related to basin shape. For instance, narrow rectilinear-shaped basins that favor trellis networks are predicted to have less opportunity to create geomorphically significant confluences because of the absence of large intersecting tributaries. In contrast, oval- or heart-shaped basins contain dendritic networks and have a greater number of larger intersecting tributaries (Figure 5).
Elongate basins with high shape values (4 - 8) generally contain trellis networks and have a low potential for confluence effects (Figure 6). Oval-shaped basins that have lower shape values and generally dendritic networks should create a higher potential for confluence effects (e.g., Figure 6).
Basin shape and network configuration influence the downstream sequence of geomorphically significant confluences along mainstem rivers that should relate to downstream patterns of confluence effects and these patterns should have ramifications for the types, spatial distribution, and heterogeneity of aquatic habitats. In addition, basin shape and related network configuration should govern the CDFs of confluence probabilities and the effects of symmetrical or asymmetrical locations of mainstem rivers that also should influence downstream patterns of riverine environments (Figure 7). For instance, a CDF indicating a relatively high proportion of high probability confluences should theoretically have a greater degree of physical heterogeneity compared to basins with CDFs having a lower proportion of high probability confluences (e.g., Figure 7, panel 2 and 3).
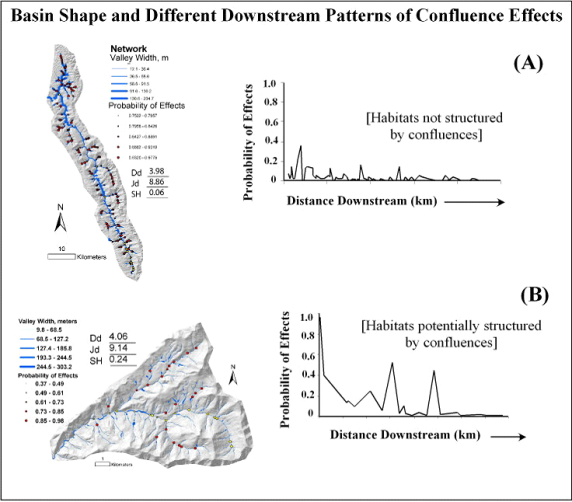 Figure 6. Basin shape and network configuration should affect the downstream pattern of tributary confluence effects and hence certain aspects of riverine habitats in mainstem rivers. (A) Redwood Creek basin in northern California is predicted to have essentially no confluence effects in the lower third of the basin and this accords with field studies (M. Madej, personal communication). However, in the heart-shaped basin of Lookout Creek the potential for confluence effects should be greater. NetMaps’ longitudinal plotting tool is used to examine spatial patterns of potential confluence effects.
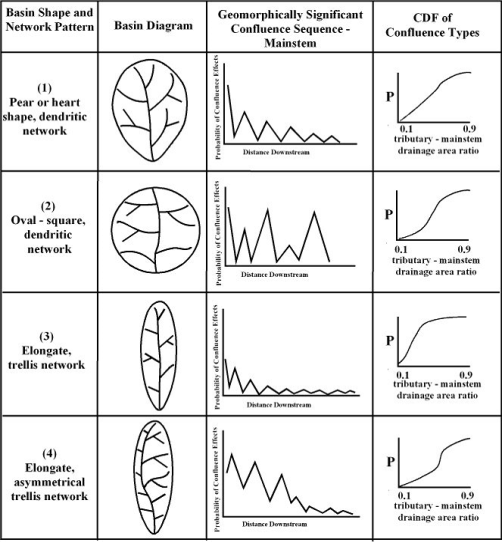 Figure 7. Watersheds can be classified by shape and network pattern to help understand the role of confluences in affecting the abundance, types, and spatial distribution of riverine habitats. Variation in network types should also translate to variations in the cumulative distribution functions of confluence probabilities (right hand panel), a network-wide gauge of the role of river networks in habitat formation. NetMap contains a longitudinal plotting tool and a CDF tool for evaluating spatial patterns of confluences and its relationship to basin shape.
NetMap contains tools for calculating drainage density (channel length/area) and the density of confluences (number of confluences/area) (Module Channel Geomorphology/Drainage-Junction Density). Watersheds with high drainage or junction density potentially should have a higher degree of habitat heterogeneity (e.g., variation in floodplains, side channels, channel gradients, and hyphoreic exchange) compared to basins of lower drainage and confluence densities (Benda et al. 2004,a).
Disturbances such as storms, fires, and floods that trigger erosion and increased sediment supply typically maintain the influences of fans on mainstem morphology. Fans at confluences are formed and rejuvenated during time periods characterized by accelerated sediment supply to rivers (Benda and Dunne 1997, Meyer and PeFielde 2003). Consequently, fans expand and contract over time in response to fires, storms, and floods, and the spatial extent of their upstream and downstream zones of influence should vary over time (Benda et al. 2003). For example, during periods of low watershed erosion, alluvial and debris fans become eroded and truncated by floods, whereas during periods of heightened watershed disturbance, fans enlarge and expand in both upstream and downstream directions.
Given this temporal variation, the size of a fan observed at any snapshot in time and their influence on channel morphology should vary with disturbance history. The temporal expansion and contraction of fans is not included in NetMap’s analysis of confluence effects because of the absence of historical information, particularly at the scale of landscapes. Hence, the prediction of confluence effects reflects an intrinsic property of networks in a temporally averaged sense. Only a portion of confluences may have morphological effects at any one time. However, the likelihood of encountering confluence effects should vary with location in the watershed. For instance, in upper regions of networks, debris flow or alluvial fans are activated during relatively infrequent (multi-decadal to century) and large magnitude sediment pulses (originating from upstream or within the main channel). The relative rarity of large erosional events higher in networks is caused by infrequency of large storms and fires over small spatial scales (Benda and Dunne 1997b). This should lead to a higher proportion of older and inactive fans. In contrast, confluences lower in the network interact with higher-frequency and lower-magnitude sediment pulses over decades because of the higher cumulative likelihood of basin erosion and floods. Therefore, in addition to having more persistent effects in rivers, junctions of large tributaries located lower in networks should have a greater age and morphological diversity of channels, floodplains, and terraces. The temporal aspect of confluence related environments can be investigated in NetMap using the PDF of sediment flux parameter (Module Aquatic Habitat/Channel Disturbance Tool).
|