| < Previous page | Next page > |
4.3 Core HabitatsFish Habitat, Core Areas (coming, updated later 2015)
Parameter Description: In NetMap, ‘habitat core areas’ identify those places in channels that have the highest habitat quality and that meet certain criteria (user input) on habitat proximity (one patch to another) and habitat persistence. NetMap contains a tool for predicting core and satellite habitats using a user defined set of thresholds for habitat quality, proximity, and persistence (length scale). The model predicts the distribution of “core habitat areas” and “satellite habitats.
Data Type: Line (stream layer)
Field Name: CoreArea__; __ is the two letter identifier for particular fish species, for example, CO=coho, CH=Chinook and so forth. Common name: Core Habitat Area_species
Units: Numeric categories; 1 = core area, 2 = satellite habitat.
NetMap Module/ Tool: Aquatic Habitats/Habitat Core Area
Model Description:
In NetMap, “core habitats” refers to specific aquatic areas within watersheds that contain the best and most stable habitats with fish populations that persist over time and that are used year after year. In contrast, “satellite habitats” are smaller and more transient and may blink on and off over time, depending on the history of watershed disturbances such as storms, floods, and erosion (e.g., Reeves et al. 1995). Core habitats in NetMap are defined by 1) habitat quality, 2) habitat proximity (e.g., habitat patches that are close to one another), and 3) habitat persistence (defined by the size [length] of habitat patches).
The conceptual basis underlying NetMap’s Core Habitat Areas tool is summarized in 4 steps (Figure 1). Step 1: create a habitat index using the ‘Intrinsic Habitat Modeling Tool’ (Module Aquatic Habitats/Aquatic Habitats). Step 2: Add additional habitat constraints such as maximum drainage area. Step 3: Define habitat quality and proximity (separation distance) thresholds. The proximity threshold allows habitat patches that meet the quality threshold to be combined together into one core area patch (Figure 1). Step 4: Select core area minimum length to define habitat persistence in the face of watershed disturbances such as floods, sedimentation and so forth.
Use of the tool in NetMap consists of the following sequence. First, make sure that a habitat index has been created (such as coho IP for example) (#1, Figure 2). Then the habitat index is selected (2) and both habitat quality (3) and habitat proximity thresholds (4) are chosen (Figure 2). Next, a minimum length scale of core habitat areas is identified (#5, Figure 2). Finally, the user selects other habitat limiting (or excluding) conditions that were not included in the original habitat index (optional). For example, site-specific knowledge of locations of bedrock rivers (i.e., lack of gravels and pools) or extreme sedimentation (leading to subsurface flow) can be used to limit habitats (6-8). The mapped results yield habitat core areas. The habitat areas that were excluded in the analysis but that meet the minimum habitat quality threshold (2-4) are classified as “satellite” habitats (e.g., Figure 2).
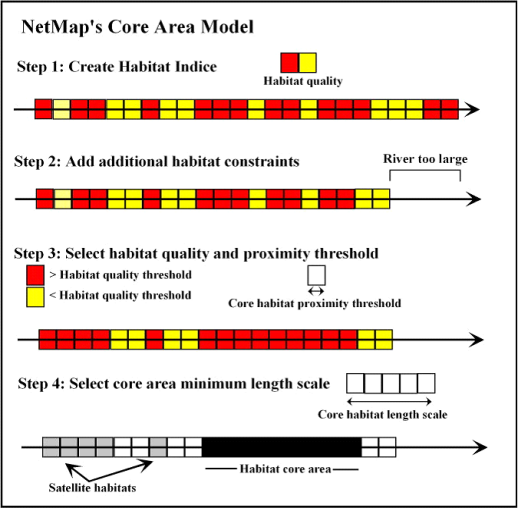 Figure 1. The use of NetMap’s Core Habitats tool is illustrated above. Step 1: A habitat index divides the network into various habitat quality values. Step 2: Add additional constraints on spatial distribution of habitat based on watershed-specific information (optional). Step 3: Habitat quality and proximity thresholds (proximity refers to the distance separating one quality habitat reach from another) are identified. Step 4: A user defined core habitat length threshold is used to create concentrations of core habitat areas. The habitat areas that are excluded but that meet the habitat quality threshold are classified as “satellite habitats”.
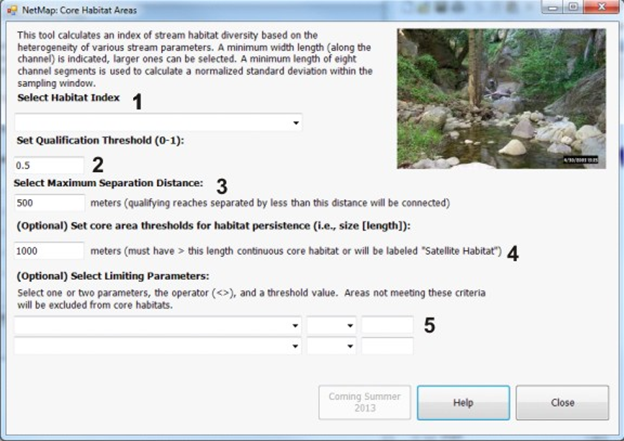 Figure 2. NetMap’s Core Habitat tool allows the user to define concentrations of aquatic habitats based on the principles of habitat quality, size, and persistence. First, a habitat index must be available, such as coho intrinsic potential (1). Next, the habitat quality threshold (2) and the maximum habitat patch separation distance (3) are selected (see Figure 1). Then, a minimum length scale of core habitat areas is defined (4). Finally, the user selects other habitat limiting (or excluding) conditions (5) that were not included in the original habitat index (optional). The mapped results yield habitat core areas. The habitat areas that were excluded in the analysis but that meet the minimum habitat quality threshold (2-4) are classified as “satellite” habitats.
Technical Background
Terrestrial ecologists have recognized that landscapes are a mosaic of vegetation patches and that animals generally use space disproportionately within the boundaries of their home range (Samuel et al. 1985). A “core area” identifies those areas within a resident animal’s home range that are used more intensively than other areas and that contain the home sites, refuges, and most dependable food sources (Kaufmann 1962. Martin and Benda 2002). The core areas concept has been used widely in wildlife and terrestrial ecology to identify ecological factors that determine space-use relationships. Bingham and Noon (1997) proposed the core areas concept be used in conservation planning because it provides a sound biological basis for identifying the area requirements for species of concern. Their proposal is based on the assumption that the core areas contain the critical habitat elements (i.e., nest sites, roost sites, access to food) for survival and reproduction of the species.
There appears to be no direct reference to the core areas concept in published literature pertaining to fish habitats, although there is information on habitat suitability and habitat selection of salmonids (Bjornn and Reiser 1991, Spence et al. 1996). Most fisheries literature address micro-habitat (e.g., depth, velocity, cover) preferences (e.g., Bovee and Cochnauer 1977, Baldridge and Amos 1981) or meso-scale (e.g., pools, riffles, glide) habitat selection (e.g., Bisson et al. 1981, Nickelson et al. 1992). In addition, studies have related juvenile salmonid survival or abundance to macro-scale (e.g., river segments or reaches) habitat complexity (e.g., Tschaplinski and Hartman 1983, Quinn and Peterson 1996, Sommer et al 2001).
One way to define core areas in aquatic ecosystems is to link critical habitat to the spatial structure or distribution of fish populations using metapopulation theory (Martin and Benda 2002). Because habitat heterogeneity has a strong influence on population structure and connectivity within and among populations, metapopulation theory is a useful tool for understanding the spatial structure of populations and the habitat that supports the population. Metapopulations are systems of local population or groups of individuals in discrete patches that are connected by dispersing individuals (strays) (Hanski and Gilpin 1991). In theory, the persistence of a group of local populations is sustained by colonization among the member populations. Several models have been proposed to describe metapopulation structure (Hanski and Gilpin 1991), and among these the core-satellite, source-sink versions seem to be the most applicable for salmonids (Li et al. 1995, Schlosser and Angermeier 1995). In these models the core population acts as a source for colonization of the satellite populations, which have a higher rate of extinction due to a number of factors including less favorable habitat conditions. The source population, which may consist of a group of populations, is assumed to persist due to patch quality, size, and connectivity, but the peripheral populations may “blink” on and off of existence as a result of poor connectivity or ephemeral habitat quality.
Despite the conceptual foundations, the core areas concept is not formally applied. Nevertheless, the concept seems to have been adopted for salmon conservation planning. This may derive from the use of metapopulation theory in support of ESU designation and the practical need of management agencies to identify habitats that need to be protected. In the classic definition of core areas, as used by terrestrial ecologists, the core areas contain the critical habitat elements for survival and reproduction of the species (Bingham and Noon 1997). In this definition, population success is defined by survival and reproduction and core areas consist of only those habitats that are essential for population success. In other words, the core area is not just a collection of habitats that may be occupied or have high-use by a population, but is a unique subset of habitats within the ecosystem that are essential to maintain a viable population.
Based on Martin and Benda (2002) and related literature on salmonid habitats (cited above), NetMap defines core habitats as a group of connected habitats that are essential to sustain a viable fish population. A group of habitats refers to multiple patches that contain the physical and biological habitat elements required for each salmon life phase and that are connected by the movements of fish between different habitats. Connectivity implies the habitats are physically accessible and are located within the migratory and dispersal range of most individuals in the population. Other habitats may provide for life history functions, but are not essential to population survival because of low productivity (production potential), poor connectivity, or lack of persistence over time (consistently support multiple generations). Sustainable means that the core area group of habitat is large enough and the ecological functions are persistent enough to maintain the population over time.
Core areas may be defined by habitat quality, persistence, and connectivity. Habitat quality generally applies to the suitability of habitats to support life phase functions (e.g., spawning and rearing) and may include both physical and biological elements. All areas that have the potential to form suitable habitat within a population’s distribution zone are candidate core areas. Among these, the habitat patches that are functionally persistent enough to maintain the population over time have the highest probability of being core areas. Habitat connectivity controls potential use. Habitat proximity to migration/dispersal routes (configuration) and distance between patches influences the probability of use and relative importance of habitat patches to the core population. Also, connectivity between areas with different functions (spawning or rearing) is important because it enables a viable life history pattern.
NetMap uses three criteria for predicting core areas: 1) habitat quality, 2) habitat proximity or connectivity, and 3) persistence, addressed by the size (length) of habitat patches. NetMap contains a tool for predicting core and satellite habitats using a user defined set of thresholds for habitat quality, proximity, and persistence (length scale). The model predicts the distribution of “core habitat areas” and “satellite habitats (e.g., Figure 1).
NetMap could benefit from additional models of habitat core areas or habitat connectivity. Thus, users are encouraged to submit new models for their inclusion into NetMap.
|