| < Previous page | Next page > |
|
4.6 Beaver Habitat Tool
Beaver Habitat Tool
Pollock, M.M., G.R.Pess, T,J. Beechie and D.R. Montgomery. 2004. The importance of beaver ponds to coho salmon production in the Stillaguamish River Basin, Washington, USA. North American Journal of Fisheries Management 24: 749-760
Parameter Description: Tool
Data Type: Line (stream layer)
Units: Binary: beaver favorable habitat (1), beaver non favorable habitat (0)
NetMap Module/Tool: Aquatic Habitats
Model Description:
The potential locations of beaver habitat is predicted based on an empirical model of beaver dams based on data from the Stilliguamish River basin, Washington (Pollock et al. 2004). The model uses a slope-area threshold of 0.3 km2, corresponding to a value of 2,000 Joules per second per meter for stream power at bankfull discharge. NetMap calculates stream power as:
SP = pgQs
where SP is stream power, p is specific weight of water (1000 kg/m3), g is acceleration of gravity (9.8 m/s2), discharge at bankfull depth (approximately two year flood, m3/s) and S is the channel gradient (L/L).
In NetMap’s user interface (Figure 1), a user can adjust the limiting threshold of stream power, the default is set at 2,000 Joules. The user can also limit the application of the model to specific areas of a watershed set by thresholds for drainage area and channel slope.
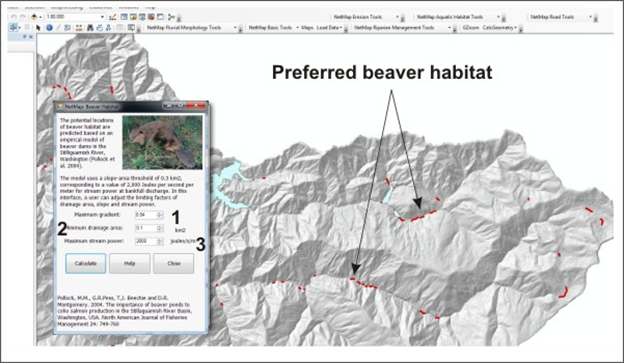 Figure 1. NetMap’s beaver tool interface uses threshold values for channel gradient (1) and drainage area (2) to determine the spatial domain within watersheds where the stream power threshold (3) is applied.
|