| < Previous page | Next page > |
InundationLayer Names: Inundation
Layer Descriptions: The Inundation layer represents the percent of time that a certain cell location is covered with water on an annual basis.
Data Type: ESRI grid
Units: Percent time
Model Description:
Inputs: The inundation program, used to calculate the percent of time that a certain cell is below water during the year, requires as inputs tide station predictions for a year, a combined topographic and bathymetric DEM http://www.ocean.washington.edu/data/pugetsound/psdem2005.html Accessed 2013., and a shapefile of tide station points. Tidal predictions should be contained in a folder of text files each pertaining to a particular tide station. Each text file must contain a year’s worth of tidal predictions (highs and lows) and can be downloaded directly from NOAA. The tidal data can be in feet or centimeters and the analyst will select which units are used based on the units in the DEM. The inundation program will run for a range of elevations which can roughly correspond to the maximum tidal range as above and below this range, topography will be 0 or 100 % inundated, respectively. The defaults are set at 30 to -100 ft. The example given here is for the Puget Sound.
The analyst will also need to provide a DEM comprised of topography and bathymetry, and with coordinate system, projection, and horizontal and vertical datums that are the same as that of the tide stations. The horizontal datum is typically available in ArcGIS, so the projection is a standard operation. The vertical transformation may not exist in ArcGIS; here is how we have approached it. NOAA tide station elevations are typically given for mean low low water (MLLW), i.e., the average of the daily lower water levels and the DEM might have a vertical datum such as NAVD88 (North American Vertical Datum 1988). We recommend using the NOAA program VDatum (http://vdatum.noaa.gov/) to calculate the vertical difference between MLLW and the DEM vertical datum. This gives a vertical shift at a point (a tide station) which needs to be applied over the area of the DEM. We generated a grid that delineated the regions of water around each tide station using the path allocation command in ArcGIS with a DEM restricted to a height of 30 ft.; areas above 30 ft. were designated NoData (-9999). The objective was to find areas of water that were nearest to each tide station linked by water (not flowing over saddles of land). When we left in areas above 30ft, the water (virtually) crossed these areas of high ground and so tide stations were linked to areas that were distant from them by water and should have been linked to other stations, this took a little trial and error; 30 ft. may not be the best height for every area. The other problem that we faced was that some stations were above the chosen elevation and needed to be included by choosing a higher elevation, helping us limit the high elevation to 30 ft. When stations are outside of the elevation limits and not accounted for, there will not be an allocation zone that represents them (Figure 1). VDatum omits some northerly tide stations but these vertical shift values can be obtained by averaging values for the nearest (by water) stations.
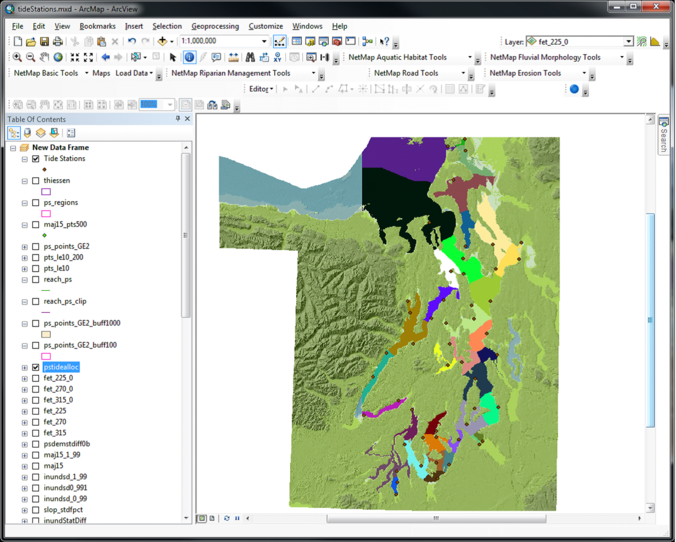 Figure 1. Results of path allocation command where the DEM was limited to an area that was too low elevation, hence the areas around some tide stations were not differentiated (e.g., black ovals).
Calculating inundation: NetMap will take the model inputs and write an input file (Figure 2) for the inundation model with the following keywords and format:
YEAR: xxxx
o 4 digit year. Some annual lists of predictions contain records for a few days before and after, these will be discarded. Leap years are accounted for.
o UNITS: ft|cm|FT|CM
o NOAA tide tables have both ft and cm, this determines output file units of elevation
ELEVATION MIN: -xx
ELEVATION MAX: xx
o must be in designated units
TIDE DATA DIRECTORY: path to tide tables
o contains Station ID tide tables downloaded as xxxxxxx.Annual
o Output file will be stored here
TIDE LIST:
xxxxxxx
yyyyyyy
END TIDE LIST:
o All tide station numbers must be within TIDE LIST and END TIDE LIST. The program will ignore any station IDs outside of these end members.
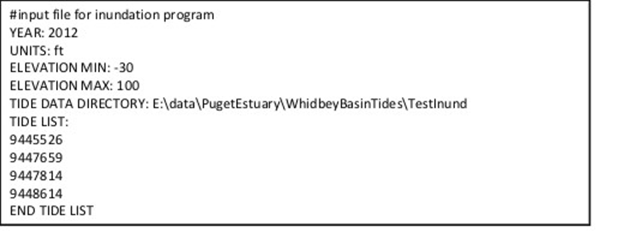 Figure 2. Example of Input text file for inundation program
The file is given as input to inundation.py.
Outputs:
1) Comma delimited result file, called stationInund.txt, will be saved to the TIDE DATA DIRECTORY. The columns represent: station ID, land elevation (units), percent inundation
2) reclassInund.txt
Format: station id * 1000 + elevation+100, percent inundation (not fraction).
The station ID +elevation combo is for use with ArcGIS’ reclass command. The station and elevation need to be in one number to match the coded grid. The number 100 is added to elevation so that there are no negative values. The station ids are left stripped of the area prefix (944 for Puget Sound); this is necessary to reduce the number of digits for the raster reclass later, not a python program limitation.
3) The second output reclassInund.txt is used to reclass the DEM to create an ESRI grid of percent inundation.
Technical Background: the inundation program calculates, for each tide station area and each elevation, the percent of time per year that tide water is above the given elevation (Figure 3). The time at which the water elevation crosses the chosen elevation is given by the intersection of elevation line and linear interpolation between tide high and low points. Although movement of tide water is typically sinusoidal, tides vary throughout the year but that detailed information is not readily available.
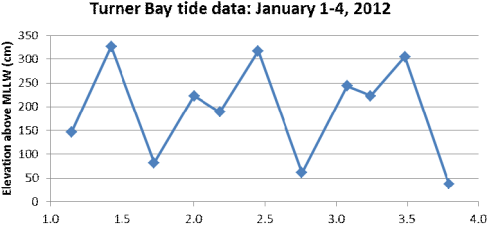 Figure 3 Tide elevations for four days with green line marking one elevation.
For the Puget Sound Inundation layer (Figure 5) a DEM was used that combined terrestrial topography and mixed source bathymetry (Finlayson, 2009). Inundation was modeled for areas with elevation ranging from -100 to + 30 ft (Figure 4). In Figure 4, the darker purple shows higher percent annual inundation.
 Figure 4. Inundation layer (purple) for the Puget Sound
The area from the NE Puget Sound was selected to be shown in more detail because is illustrates the value of the inundation program in one practical context. Over the early to mid-twentieth century, the hydrologic regimes of land on the estuaries of the Skagit and Stillaguamish rivers were highly modified with numerous dikes, tide-gates, and drains (WWAAA/NOAA NMFS/WADFW, 2008). The inundation layer overlays many fields and other reclaimed areas (Figure 5a) and for comparison, the historic land cover types are also shown (Figure 5b). The historic land cover types are estuarine emergent wetland (light yellow), estuarine scrub shrub wetland (dark yellow), riverine tidal scrub-shrub wetland (turquoise), riverine tidal forested wetland (light blue), palustrine scrub-shrub wetland (mid blue), and palustrine forested wetland (dark blue). See also help for the probability of saltmarsh and probability of mudflat layers.
 Figure 5 (a) Skagit and Stillaguamish Estuaries with extent of percent annual inundation compared to (b) historic extent of estuarine and riverine land cover types (WWAAA/NOAA NMFS/WADFW, 2008). References
Finlayson DP, 2005. Combined bathymetry and topography of the Puget Lowland, Washington State. University of Washington, (http://www.ocean.washington.edu/data/pugetsound/)
Finlayson DP, 2006. The geomorphology of Puget Sound beaches. Puget Sound Nearshore Partnership Report No. 2006-02. Published by Washington Sea Grant Program, University of Washington, Seattle, Washington. Available at http://pugetsoundnearshore.org. Accessed 2013.
WWAAA/NOAA NMFS/WADFW, (Western Washington Agricultural Association, NOAA’s National Marine Fisheries Service, Washington Department of Fish and Wildlife) 2008. Skagit Delta Tidegates And Fish Initiatives Implementation Agreement. Accessed 2013. http://wdfw.wa.gov/licensing/sepa/2008/08036_agreement.pdf
|