| < Previous page | Next page > |
7.1 Wildfire CascadeWildfire Cascade
Parameter Description: This tool allows display of predicted wildfire probability and fire severity (flame length) using data available from Western Wildland Environmental Threat Assessment Center (WWETAC). Post fire erosion (surface erosion using the WEPP model) is also available in the tool is based on results from Miller et al. (2011). An analyst can use this tool to quickly search for spatial overlaps of where predicted high fire probability and or severity overlaps various types of erosion potential and where those overlap with sensitive aquatic habitats. See examples below.
Note: For smaller scale, site specific analyses of fire risk and post fire surface erosion, including for post fire BARC analysis, see NetMap's Fire-Erosion tool. TerrainWorks (NetMap) can analyze pre and post wildfire risks to erosion, water quality and fisheries in support of wildfire planning, including during a BARC process for clients, including posting results in an online browser to ease access of information; see here.
Data Type: Grid (Raster); Line (stream layer)
Fire Probability
Field Name: pFire; Common Name: Wildfire Probability (Grid)
Field Name: pFire; Common Name: Wildfire Probability-segment scale (reach)
Field Name: pFireCum; Common Name: Wildfire Probability-averaged downstream (reach)
Fire Severity (flame length)
Field Name: Flamlen; Common Name: Flame Length (Grid)
Field Name: Flamlen; Common Name: Flame length-segment scale (reach)
Field Name: FlamLenCum; Common Name: Flame length prediction-averaged downstream (reach)
Post Fire Surface Erosion
Field Name: WEPPMEM; Common Name: Post Fire Surface Erosion (grid)
Field Name: WEPP_MEM; Common Name: Post Fire Erosion, Segment Scale (reach)
Field Name: WEPP_MEMC (average); Common Name: Post Fire Erosion - averaged downstream (reach)
Miller, M.E., L.H. MacDonald, P.R. Robichaud and W.J. Elliot. 2011. Predicting post fire hillslope erosion in forest lands of the western United States. International Journal of Wildland Fire 20, 982-999
Note the predicted post fire erosion is multipled by predicted fire probability to produce an index of erosion that is scaled by the frequency of fire occurrence. Hence, the post fire erosion index provides information on the relative magnitude of erosion linked to fires and its variation across landscapes.
Units: Fire probability = probability (1/p = recurrence interval);
Flame length in feet;
WEPP post fire erosion in T/yr (but note attribute modification above that renders the surface erosion prediction into a relative index of surface erosion, scaled by fire probability).
NetMap Module/Tool: Vegetation/Fire/Climate - Fire Cascade
Model Description:
Wildfires can represent a significant environmental stressor. High fire severity (large flame length) can lead to extensive areas of mineral soil, accelerated erosion (surface, gully, landsliding), increases in channel sedimentation and large impacts on water quality and fish habitats. This is referred to as the “Wildfire Cascade” in NetMap (Figure 1). However, under certain conditions, wildfires and associated accelerated delivery of sediment and organic material to streams can provide long term net ecological benefits (Benda et al. 2003)
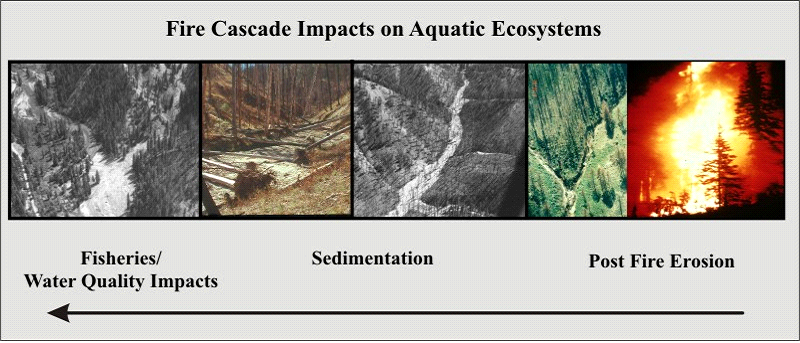 Figure 1. A “fire cascade” is the cascading sequence of impacts that begins with high severity fire, accelerated erosion, increased channel sedimentation and large impacts on fisheries and water quality.
The tool interface is shown in Figures 2 and 3. When the Fire Cascade tool is first used in a NetMap dataset, a user must download the fire and erosion files (#1, Figure 2). The user must then "route" (#2) the grid (raster) data into the channel network (segment scale, via Drainage Wings) and downstream. Values downstream represent a running average. A user than uses the drop down list (#3) to display: a) any of the gridded data (fire probability, fire severity, post fire surface erosion), b) the channel segment scale version of those (fish eye view), and c) a running average of those values downstream.
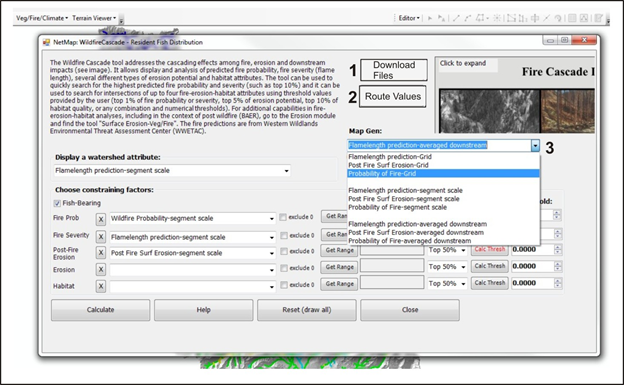 Figure 2. Wildfire Cascade user interface.
A key element of the Wildfire Cascade tool is the ability to search for any percentile of the distribution of fire probability, fire severity or post fire erosion (e.g., top 50%, 10%, 1% etc.). In addition, a user may search for overlapping stressors at any percentile of the distribution (say top 10% of fire probability with top 10% of fire severity). With up to four overlap options, a user can search for any combination of fire and erosion stressors and aquatic habitats.
An analyst first selects a parameter for display (4, Figure 3). Next, they can select any combination of one to four fire probability, fire severity, erosion and habitat parameters (5, Figure 3). If there are zeros (0) in the data, a user can optionally remove those from the distribution (6). A range of values can be displayed (7) in the window (8). A drop down window (9, and see Figure 4) is used to select from any portion of the distribution. Then a user MUST calculate a threshold (#10, Figures 3 and 4). Press "calculate" (12, Figure 3) to view the results (in the display, using the attribute chosen (4).
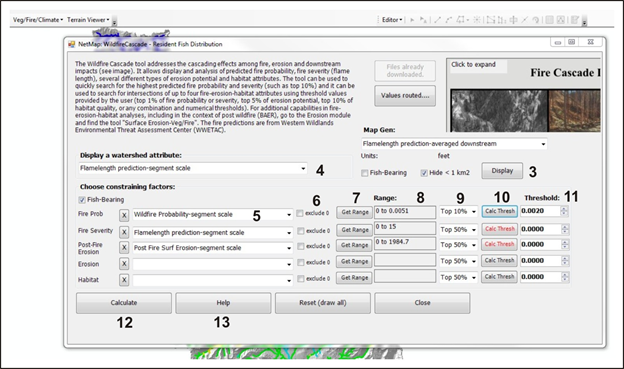 Figure 3. Wildfire Cascade user interface.
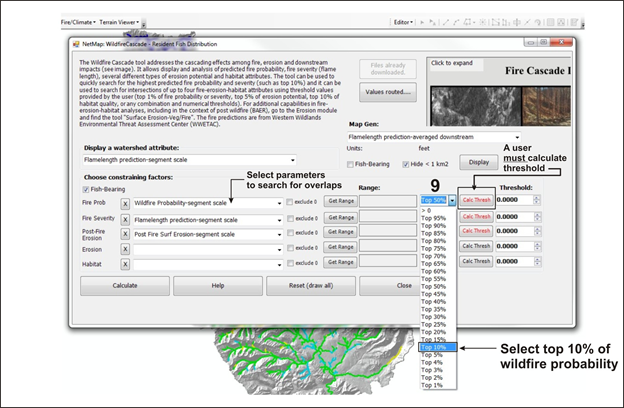 Figure 4. Wildfire Cascade user interface.
Extent of Post Fire Surface Erosion Data
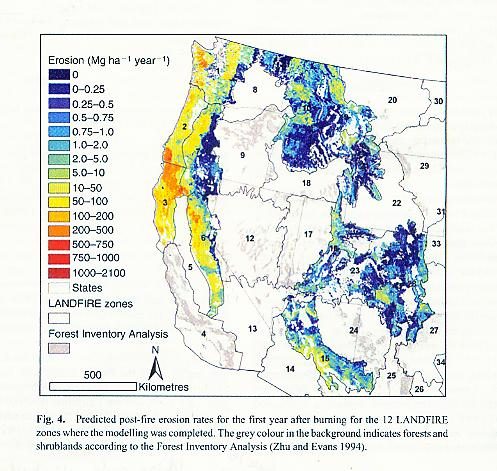
The WWETAC fire prediction data generally covers the entire forested western US. The post fire surface erosion data of Miller et al. (2011) contain gaps in coverage. See Map below from Miller et al. 2011.
 Example Application:
Wildfire Analysis
Fire probability and fire severity (flame length) were accessed from federal wildfire predictions (WWETAC). The post fire erosion prediction (surface erosion using the WEPP model) used results from Miller et al. (2011). Wildfire probability and severity forecasts were available for only the US portion of the Flathead River watershed. Figure 5 shows the spatial data (grid) on forecasted wildfire probability (1/p = fire recurrence intervals) and the predicted fire severity (flame length in feet).
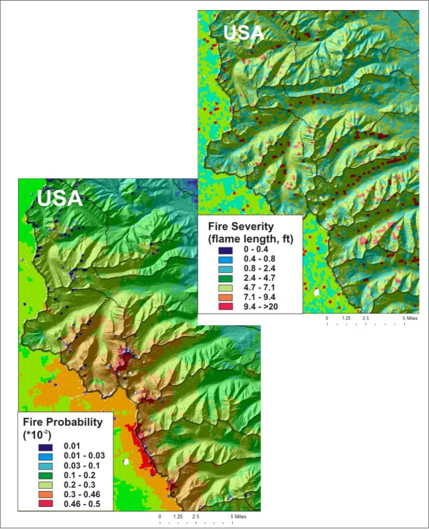 Figure 5. The predicted fire probability (lower) and fire severity in terms of flame length (upper) are mapped across the US portion of the Flathead River watershed. See Figure 6 for a fish eye view of fire severity.
Using the channel segment scale drainage wings in NetMap, predicted fire severity is reported to stream segments, offering a channel- or fish-eye view of fire severity (Figure 6). In addition, the channel segment values are aggregated (summed and area weighted) downstream in NetMap, providing a means to examine predicted fire severity at any spatial scale defined by the channel network (Figure 7). NetMap’s Fire Cascade tool is used to quickly identify locations in the Flathead River watershed where the highest fire probability overlaps with the highest fire severity, and where that pair of stressors intersect with cutthroat trout habitat (Figure 8).
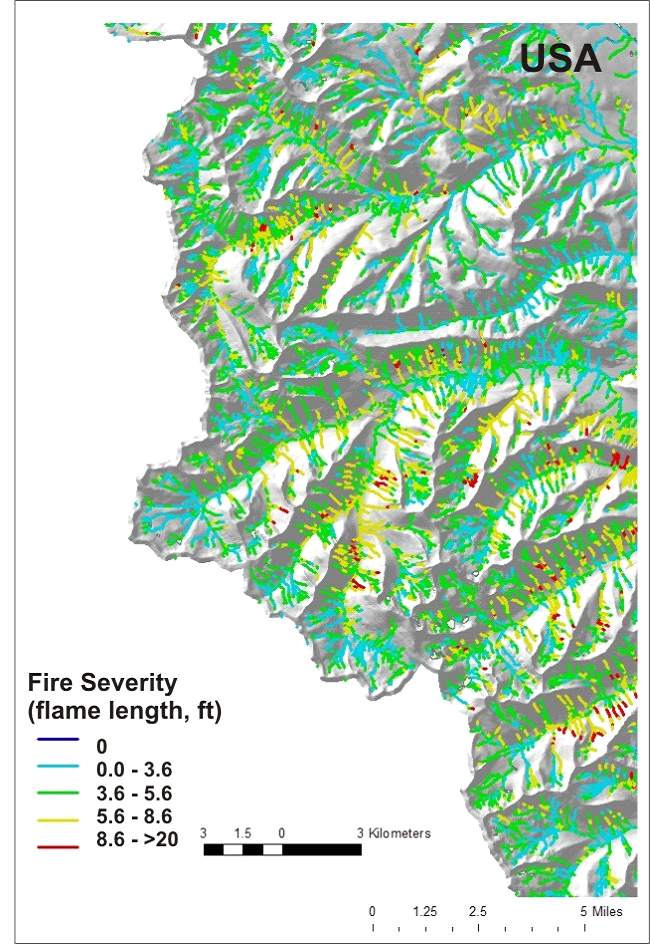 Figure 6. Predicted fire severity in terms of flame length is mapped onto individual channel segments using NetMap’s reach scale local contributing area, providing a fish eye view of fire severity.
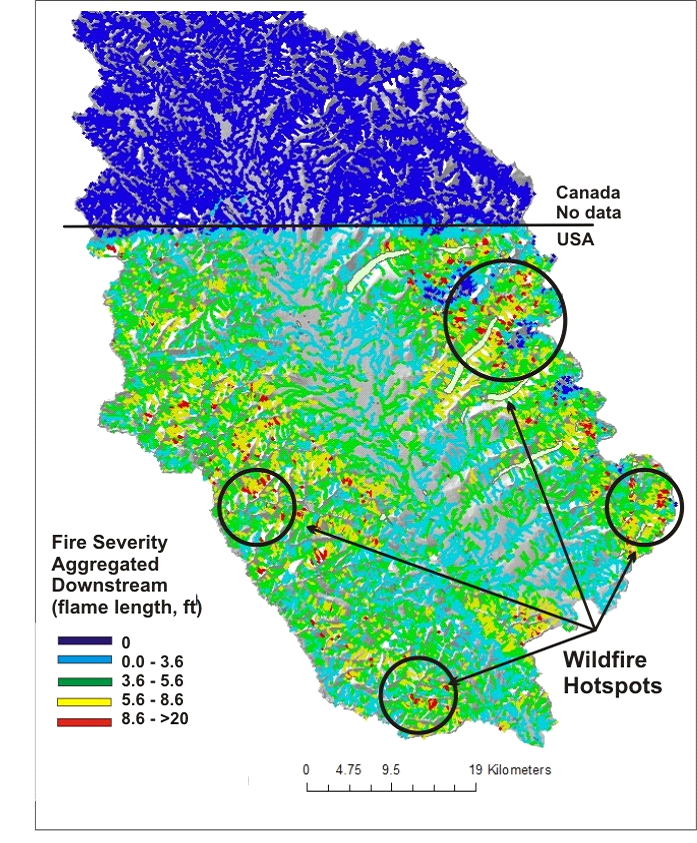 Figure 7. Predicted fire severity (flame length) is aggregated downstream revealing tributary scale patterns of fire severity across the US portion of the watershed. The smaller tributaries with the highest fire severity are shown in red indicating general geographic areas with higher fire severity potential.
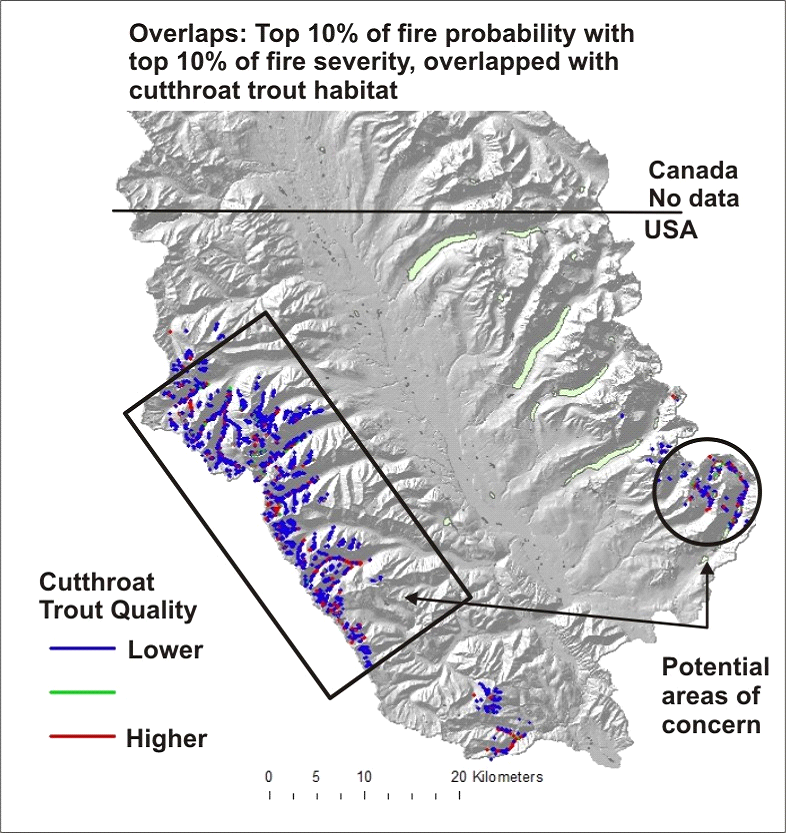 Figure 8. NetMap’s Fire Cascade Tool is used to identify intersections among various watershed attributes. Illustrated here is the intersections between the highest 10% of fire probability and the highest 10% of fire severity. These areas as represented at the channel segment scale (4% of all segments) are mapped (color coded) according to the predicted westslope cutthroat habitat intrinsic potential score (habitat quality). Certain areas of the Flathead River watershed are highlighted (no data in the Canadian portion). This information, among other NetMap analyses, could be used in pre wildfire planning activities (e.g., fuels reduction, prescribed fire etc.).
An analysis of the highest predicted fire severity and the highest predicted post fire erosion (using results from Miller et al. 2011) reveal where the intersections exist between these two stressors (Figure 9).The area of the greatest risk is located in the southeastern portion of the higher elevation areas of the Flathead watershed. Such information could be used to help guide wildfire mitigation efforts, including fuels reduction.
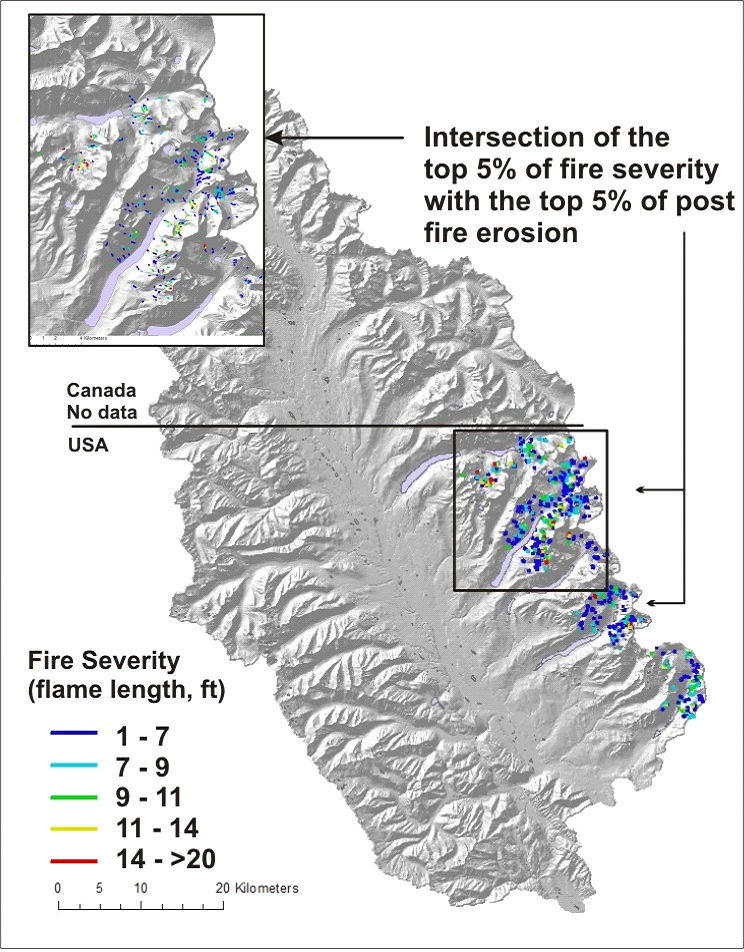 Figure 9. NetMap’s Fire Cascade Tool is used to identify intersections between the highest 5% of fire severity and the highest 5% of post fire erosion potential (surface erosion). This type of information could be used to inform pre wildfire planning strategies.
Such stressor analyses can include fire probability, fire severity and post fire erosion, providing additional data to inform pre wildfire planning (Figure 10).
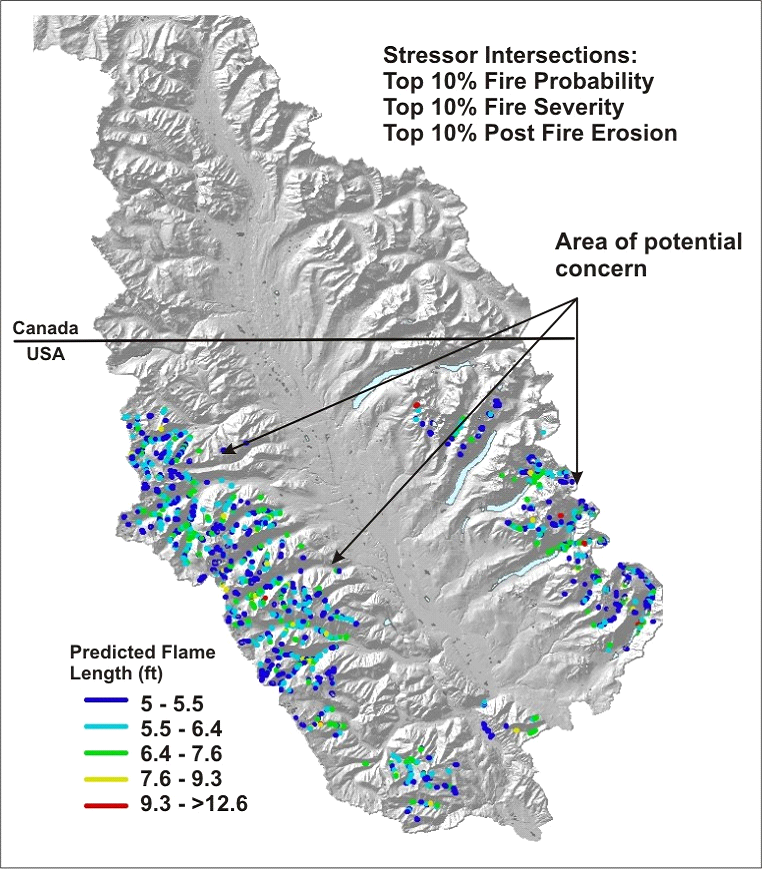 Figure 10. Locations (as reported in channels but representing adjacent hillside, via drainage wings) in the Flathead River basin where the highest (top 10%) fire probability, fire severity and post fire erosion overlap.
|