| < Previous page | Next page > |
Routing of Hillslope AttributesRouting of Hillslope Attributes (including from within a buffer)
Tool Description: Any hillslope raster (e.g., fire risk, vegetation age, erosion potential etc.), is summarized at the scale of drainage wings, or a portion thereof encompassed within a stream-adjacent buffer or any channel reach attribute can be aggregated downstream (see Upstream - Downstream Aggregation tool). See below for the use of a buffer.
Examples:
(1) Forest Age
The user imports a polygon layer loaded with values of vegetation or forest age. The “Import” tool is used to import spatial data. Data are summarized at the scale of drainage wings and then routed downstream.
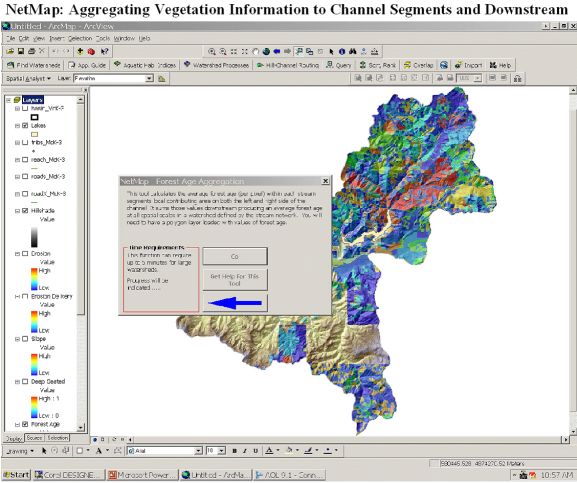 Figure 1. A raster of forest ages (shown in the outdated Arc9.3 NetMap interface).
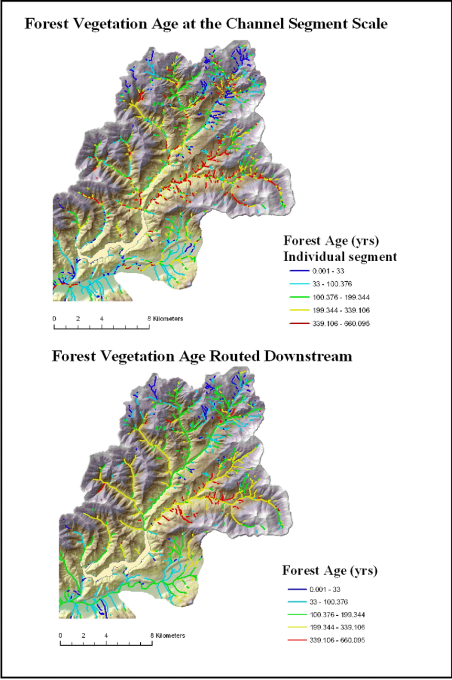 Figure 2. NetMap analysis of forest age as reported to individual stream segments (upper) and routed downstream (lower) revealing patterns of forest age at any spatial scale defined by the river network.
(2) Fire Risk
A user imports a polygon layer loaded with values of fire risk indices. The “Import” tool is used to import spatial data. Data are summarized at the scale of drainage wings and then routed downstream.
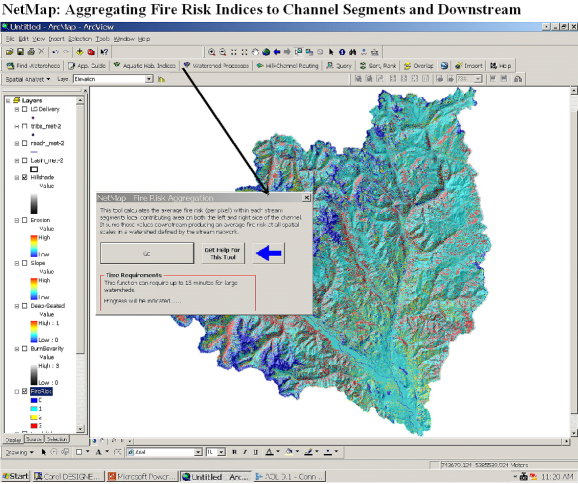 Figure 3. A grid (raster) of fire risk indices, shown as 1-3 ranging from high (3), moderate (2) to low (1) (shown in the outdated Arc9.3 NetMap interface).
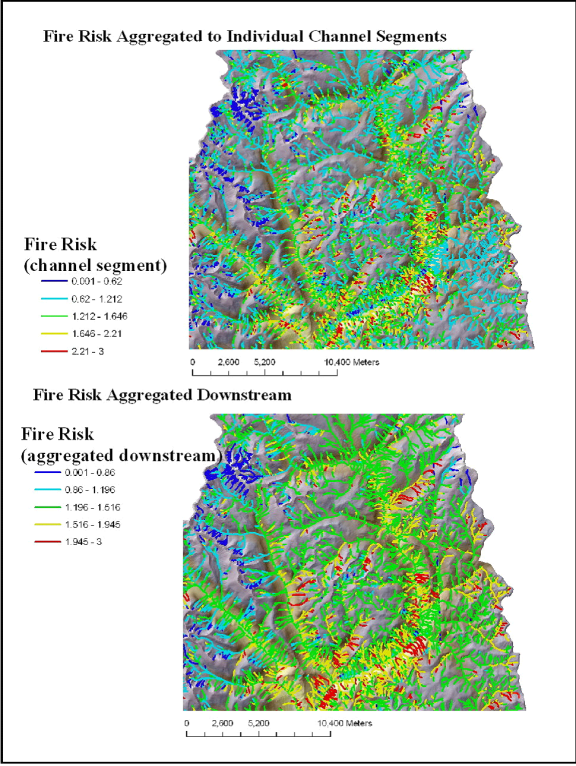 Figure 4. NetMap analysis of fire risk as reported to individual stream segments (upper) and routed downstream (lower) revealing patterns of fire risk at any spatial scale defined by the river network.
Post-Fire Burn Severity
A user imports a polygon layer loaded with values of burn severity indices, generally ranked as high (1), moderate (2) and low (3). Data can also include "no fire". The “Import” tool is used to import spatial data. Data are summarized at the scale of drainage wings and then routed downstream.
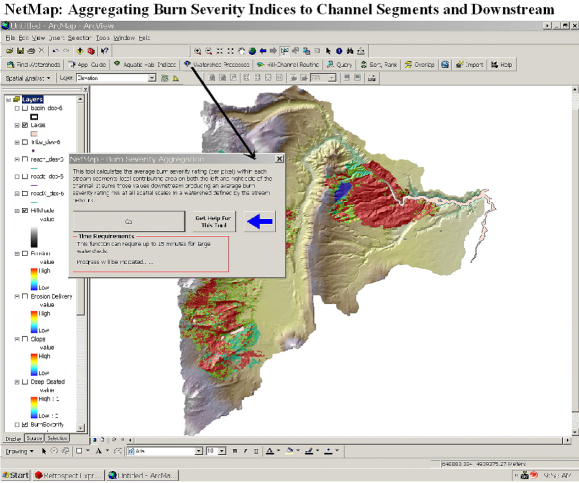 Figure 5. A grid (raster) of post fire burn severity (BARC map); indices range from 1-3 ranging from high (3), moderate (2) to low (1) (shown in the outdated Arc9.3 NetMap interface).
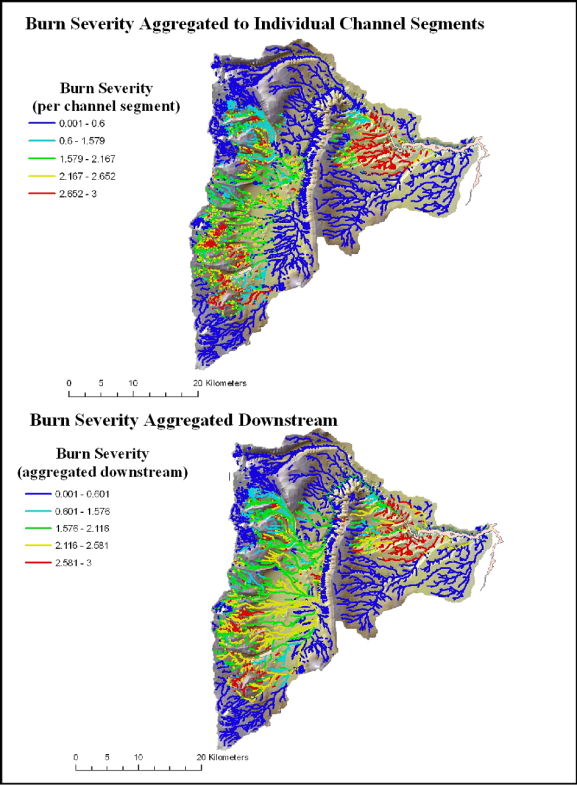 Figure 6. NetMap analysis of post fire burn severity as reported to individual stream segments (upper) and routed downstream (lower) revealing patterns of burn severity at any spatial scale defined by the river network.
Routing of Hillslope Attributes from a Buffer
Tool Description: Any NetMap channel hillslope attribute (raster or grid) can be aggregated or routed (length weighted average or summed) downstream, revealing patterns at any spatial scale defined by the channel network (see Routing of Hillslope Attributes). In this version of the tool, a user selects a buffer (width) from which to select only those hillslope attributes that fall within it, to report to channel segments and to route downstream.
Data Type: Line (stream layer)
Field Name: variable, depending on selected hillslope data; Common Name: Given by the user during use of the tool
NetMap Module/Tool: Base Tools/Routing of Hillslope Attributes from within a Buffer
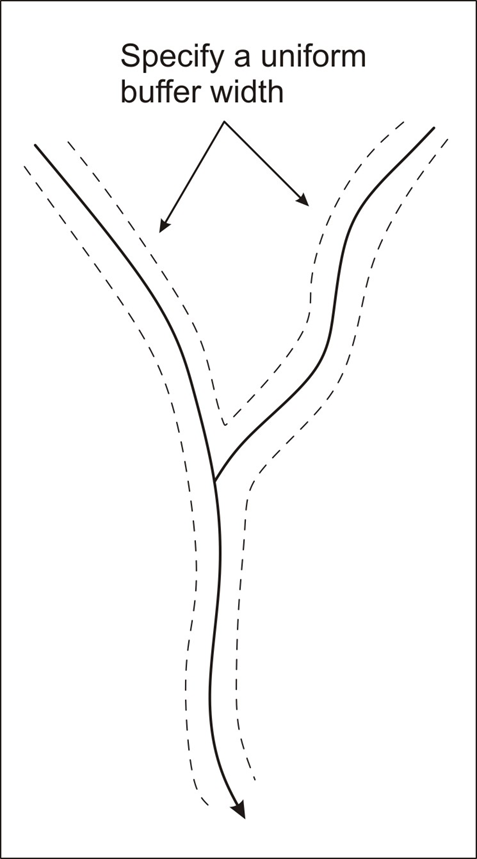 Figure 1. A user must select a buffer width.
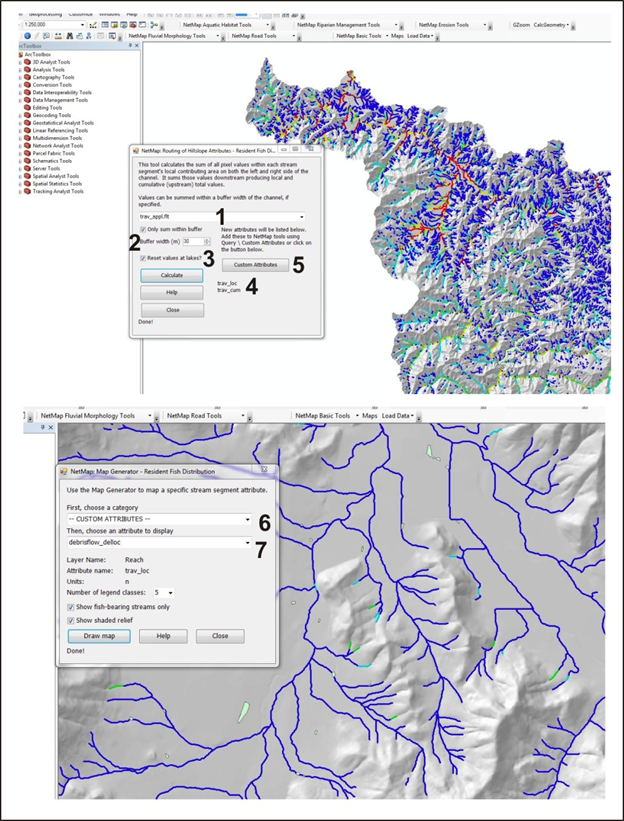 Figure 2. Any available hillside attribute, in the form of a grid, is selected (1). A buffer width is defined (2). Downstream routed values can be interupted and set back to zero at lakes (3). After running the tool, the names of the files created are shown (4). variable_"loc" and variable_"cum" refers to, respectively, "local" meaning hillslope attributes reported to individual channel segments and "cum" meaning hillslope attributes reported cumulatively downstream.
To display the new attributes, a user selects "custom attributes" (5) and provides a common descriptive name. Such new attributes can be shown by going to NetMap's map generator, scrolling down through the "categories" until locating "custom attributes".
|