| < Previous page | Next page > |
NetMap Quick ToolNetMap Quick Tool
NetMap's Quick Tool is designed as an easy alternative to NetMap's full blown tool kit (containing 95 tools and over 100 parameters). It operates as an ArcMap Add-in (similar to the full NetMap tools) and contains just three types of functionality:
(1) Set Environmental Variables (so the tool knows where to look to find NetMap datasets);
(2) Load data (loading individual NetMap datasets);
(3) Map display with constraints on drainage area of channels (eliminate channels of a certain size threshold) and on Fish Bearing/No Fish Bearing; and
(4) The Habitat - Stressor Overlap Tool; refer to this technical help for information on running this tool.
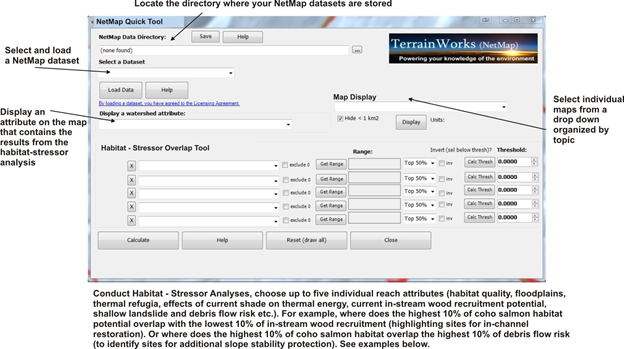 Figure 1. NetMap's Quick Tool - designed for users who do not need the full functionality of NetMap tools. To learn about the Habitat-Stressor tool, go here.
Examples of Habitat Stressor outputs:
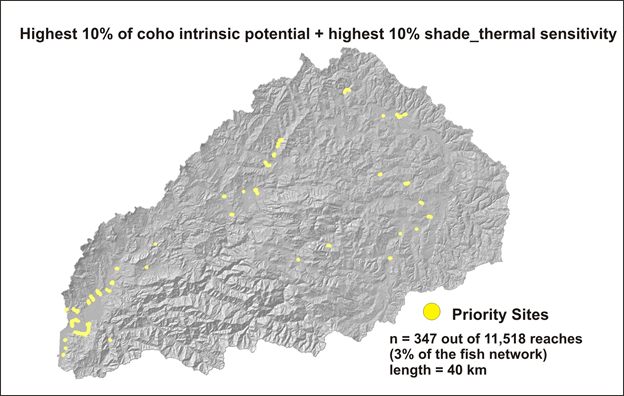 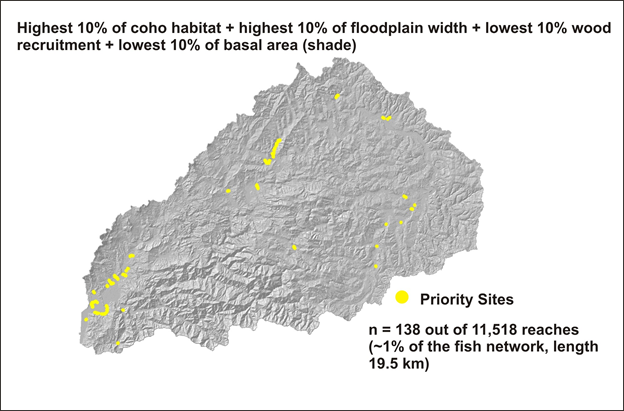 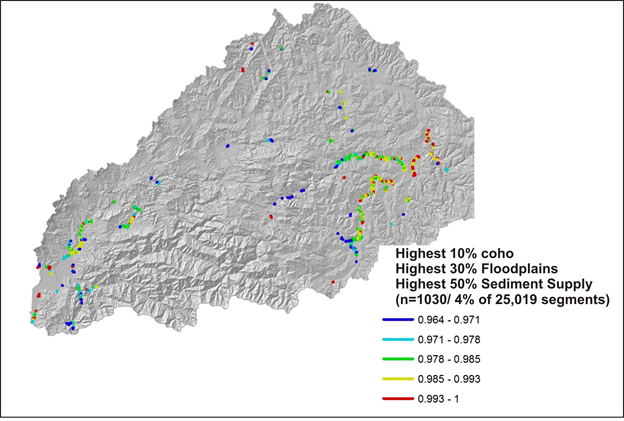  Figure 2. Some examples of running NetMap's overlap tool. To see the full analysis in support of watershed restoration, see here for self guided PPT-PDF and here for the video.
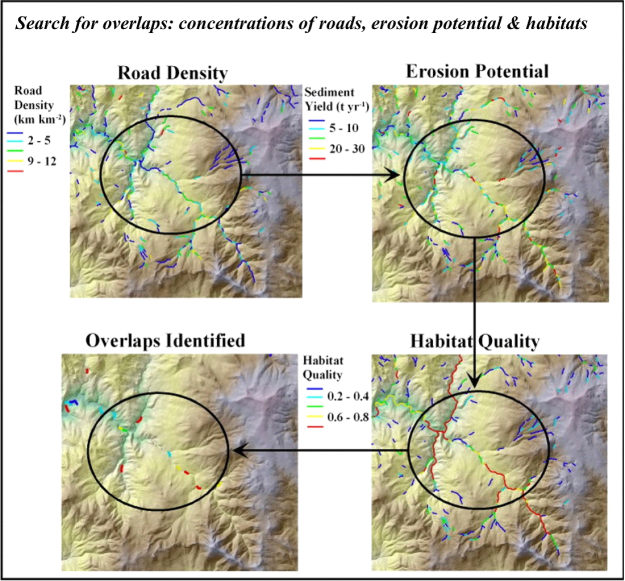 Figure 3. An illustration in the use of NetMap’s overlap tool shows how Road Density (calculated at the scale of individual channel segments, using Drainage Wings, is overlaid on the inherent erosion potential of hillsides (using Generic Erosion Potential), and which is further overlaid on fish habitat quality (Intrinsic Potential). A user selects threshold values for these three attributes (e.g., top 10%, top 5%, top 1% etc.) using the Overlap Tool (Figures 1-2), and reaches where these thresholds overlaps are identified (and in this example, color coded by fish habitat quality). Hence an analyst can quickly identify where in a large watershed, the greatest potential exists for road related impacts on habitats, are located. Field programs or restoration activities can be tailored to match these findings.
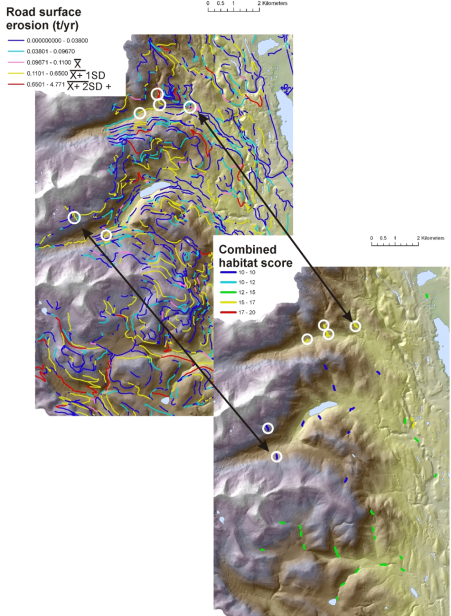 Figure 4. An example result of using NetMap’s overlap tool where road surface erosion in streams is compared to a combined habitat score for Bull and Cutthroat trout. For additional information about this analysis in western Montana, see Road Surface Erosion.
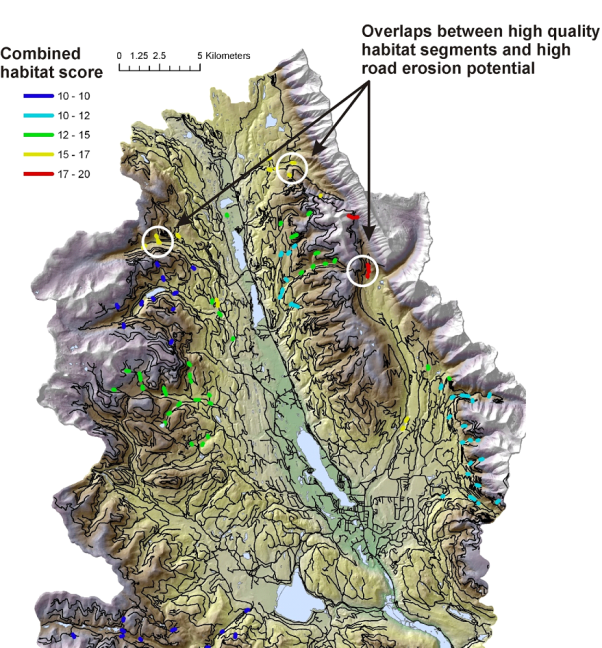 Figure 5. The map display shows the combined aquatic habitat score, where there are overlaps between the top 5% of road surface in streams. A user could apply this approach to prioritize where to conduct additional field surveys of road conditions and for developing road restoration strategies. For additional information about this analysis in western Montana, see Road Surface Erosion.
Visual Analysis (Overlap Detection)
Geospatial information (within a GIS) can be used, also in conjunction with other tools such as Google Earth, to identify relationships between areas of provisional high hazard in a watershed and other resource values.
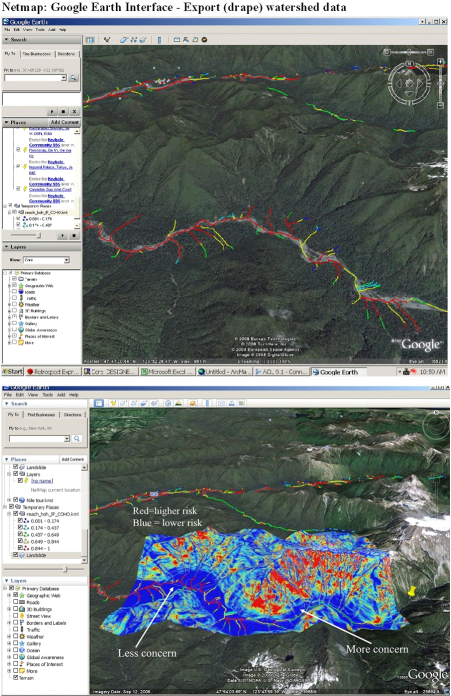 Figure 6. Using NetMap’s Google Earth Tool, users can export watershed attributes such as habitat intrinsic potential for steelhead (Top) and predicted hillslope erosion potential (Generic Erosion Potential). Spatial overlaps between areas of high risk and areas of sensitive habitats can be quickly identified. Example is from the Hoh River basin in western Washington.
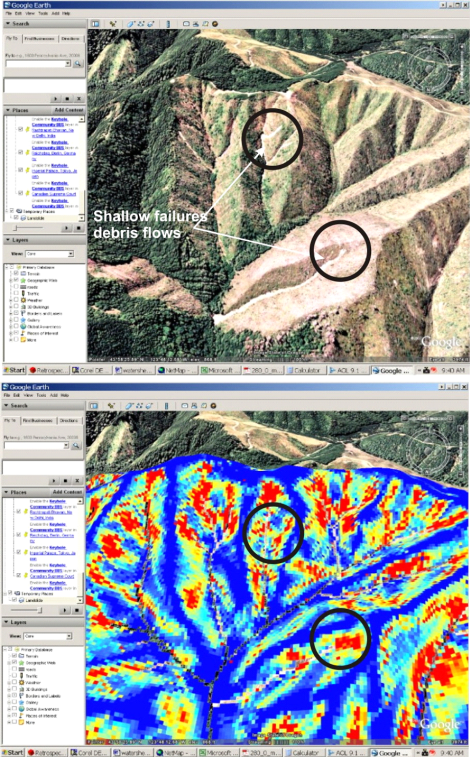 Figure 7. Following export of NetMap’s erosion attributes (in this example, Generic Erosion Potential), NetMap users can drill down to the scale of individual hillslopes to identify landslide prone areas that may be susceptible to timber harvest and road construction. Example from a particularly steep and dissected area of the Oregon Coast Range.
|