| < Previous page | Next page > |
SkewChannel Dynamics - Skew
Parameter Description: The predicted skew of the sediment yield probability density function (PDF) is an index of the degree of temporal variability in terms of frequency and magnitude of sediment supply. The skew may be useful when considering the dynamic aspects of channel morphology that might be useful from a perspective of channel restoration or monitoring; the skew can be used in the NetMap’s Channel Disturbance Tool. There are two skew parameters, in-stream and at junctions.
Data Type: Line (stream layer)
Field Name: Skew, Skew_Junc; Common Name: Skew, Skew-Junction
Units: numeric
NetMap Module/Tool: Fluvial Morphology/Channel Disturbance Tool
Model Description:
Sediment yields, as measured (or simulated) in rivers over decades to centuries, can be highly skewed due to the stochastic nature of erosion including storms, fires, and floods (Benda and Dunne 1997a,b). In addition, the shape of the sediment yield probability distribution (PDF) evolves from highly skewed to more symmetrical forms downstream (Figure 1). In NetMap, a user provides an estimate (or a reasoned guess) of the skew of sediment flux from headwater, first-order streams (Figure 2). The model then predicts the evolving skew of the PDF downstream based on simulation modeling in the Oregon Coast Range (Figure 3). NetMap calculates the skew for every segment in the channel network (Figure 4). The tool also creates maps of headwater tributary basin skews as reflected within mainstem channels, at the junction (to represent the potential consequences of highly skewed PDFs of sediment supply from tributaries in mainstem rivers, Figure 5).
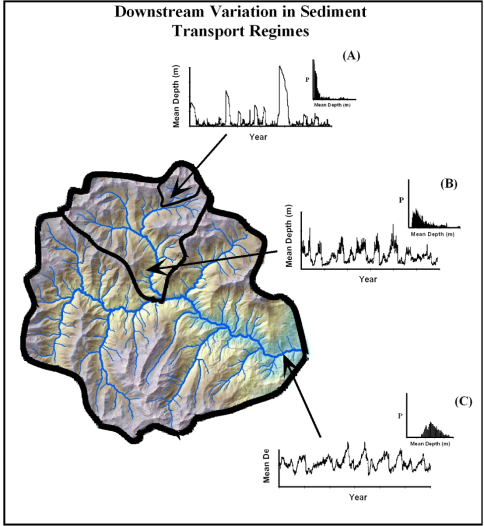 Figure 1. Frequency and magnitude of sediment-related disturbances vary with basin size, which influences the age distribution of fluvial landforms, particularly at confluences. (A) Sediment related disturbances are large but rare in headwaters. (B - C) Disturbances are more frequent but of lower magnitude further downstream in a network. The evolving shape of the probability distribution of sediment storage in channels (reflecting the supply and transport of bedload) ranges from highly skewed in the headwaters (A) to log normal in the central part of the network (B), and to approximately normal downstream (C). This pattern reflects a property of the central limit theorem; see Benda and Dunne (1997a,b) for further details. Also the spatial pattern of the PDF of sediment storage in certain network types has implications for riverine diversity (see Benda et al. 2004a).
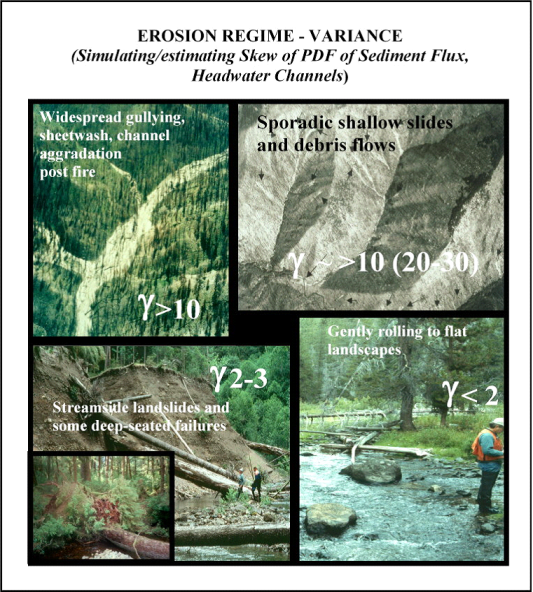 Figure 2. The frequency and magnitude of erosion (and sediment transport) within a basin should vary across different landscapes. The erosion and sediment transport regime and the role of extreme erosion events in shaping fluvial processes and hence ecological conditions can be characterized by the skew of the probability distribution of erosion events over decades to centuries (Benda and Dunne 1997a,b). The most extreme erosion regimes in the western U.S. may occur in semi-arid areas (A). Somewhat less extreme erosion and sediment transport regimes occur in the humid temperate landscapes of the Pacific Coast (B). These steepland landscapes may have skews of sediment yield PDFs in the range of 5 to 30, based on simulation models. Lower relief and low gradient headwater basins may have probability distributions of erosion with a lower skew (<5) and hence have few geomorphically significant extreme events (C and D). In NetMap’s tool, a user makes a reasoned estimate of the skew of the PDF of erosion and sediment yield in their target basin.
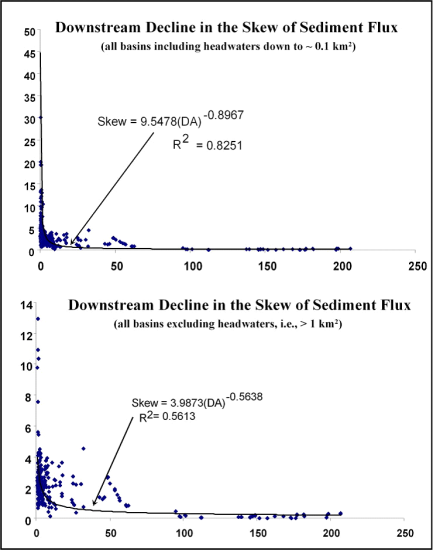 Figure 3. The skew of the probability distribution (PDF) of sediment flux in a mountain drainage basin provides an indication of the erosion and sediment transport regime. A PDF with high skew (>5 and up to 20 or 30) may indicate a regime characterized by high magnitude and low frequency events driven my mass wasting, such as debris flows in headwater channels or post fire gully erosion. A PDF with low skew (<5 to less than 1) indicates a regime characterized by lower magnitude but higher frequency events driven by more frequent storm-based fluvial processes. Based on stochastic simulation modeling of erosion and sediment flux over centuries in a humid mountain drainage basin (Benda and Dunne 1997a,b), the skew of the probability distribution (PDF) of sediment yield decreases non linearly downstream. Thus, sediment-related disturbances should tend to be larger (with respect to the channel and valley floor) but of lower frequency in upper portions of networks (i.e., mass wasting generated sediment supply) and of a lower magnitude but of higher frequency in lower portion of river basins (i.e., sediment supply dominated by in-stream fluvial processes).
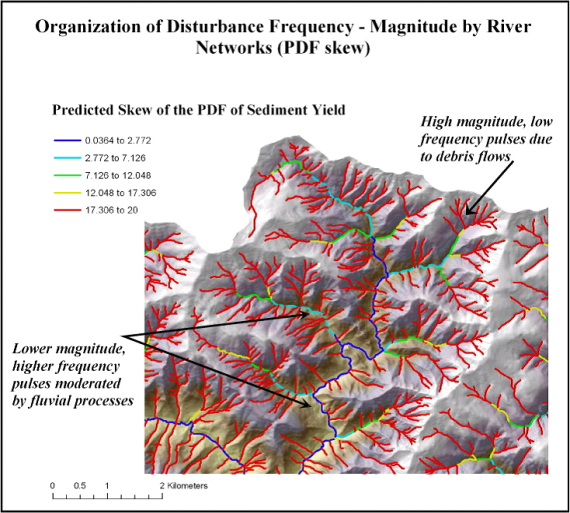 Figure 4. NetMap contains a tool for estimating how the skew of the PDF of sediment yield (or flux) decreases downstream based on the relationship shown in Figure 3. The user must provide an estimate (or a guess) of the skew of erosion and sediment flux in headwater channels. In this example in coastal Oregon, the headwater skew was estimated to be 4, based on simulation modeling in similar landscapes (Benda 1994).
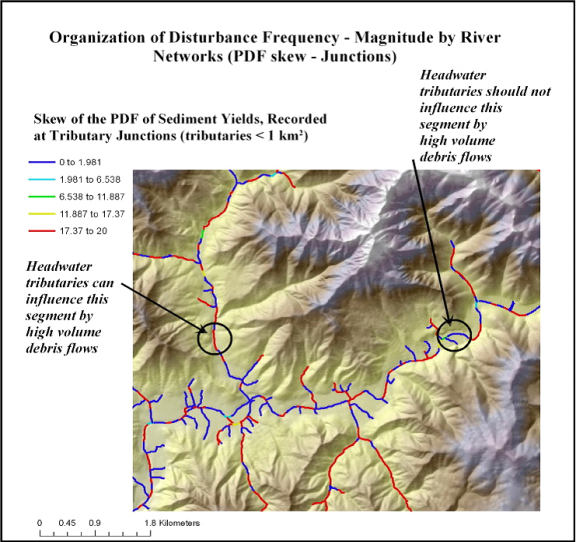 Figure 5. NetMap reports the skew of the PDF of sediment flux of intersecting tributaries along mainstem channels at junctions (in the mainstem channels). This provides an indication of the influence of the erosion and sediment flux regime in tributaries on mainstem channels. The pattern above suggests that the upper region of the watershed would have a higher disturbance potential in mainstem channels at junctions due to highly punctuated sediment supply related to a high density of short, steep tributaries. In contrast, the lower area has a lower disturbance potential at confluences because of the lower density of small, steep tributaries. In the event that more than one tributary intersect a mainstem channel segment (particularly in headwater areas), NetMap reports the highest skew value.
Technical Background:
A key relationship between river networks and sediment-related watershed disturbance regimes is the skew of the PDF of sediment yield (Figure 2) and the expected downstream change in sediment fluctuation frequency and magnitude (Figure 1). NetMap includes a simplified way to predict the downstream change in the skew of the PDF of sediment flux. Based on stochastic simulation modeling, the skew of the PDF decreases non-linearly downstream (Figure 3).
Sediment disturbance regimes, that can be characterized by PDFs of sediment yields, converge at tributary confluences (Figure 6). Although the skews of PDFs in mainstem river segments represent the larger channel’s sediment regime, often it is the skew of the PDF of the confluencing tributary that has significant morphological consequences in the mainstem channel segments (at and immediately up- and downstream of confluences) (Benda et al. 2004a,b). For example, debris flows reflect a highly skewed PDF of sediment flux and they are responsible for creating large morphological changes in channels and valley floors of mainstem rivers (Benda 1990, Grant and Swanson 1995, Hogan et al, 1998, Benda et al. 2003, Bigelow et al. 2007); also see NetMap’s ‘Confluence’ parameters in the ‘Fluvial Morphology Module’.
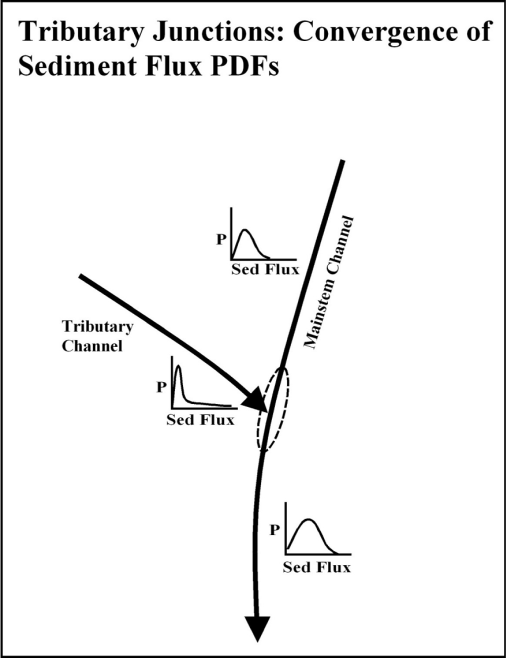 Figure 6. Although the mainstem’s has a skew of the PDF of sediment flux (according to drainage area), the tributary skew often strongly influences the morphology of the mainstem channel and valley
|