NetMap's Technical Help Guide

Model #1 Full BBN

 
Model #1 (Full BBN)
Declines in native fish populations such as westslope cutthroat trout (WCT) are generally due to habitat fragmentation, the presence of anthropogenic barriers, as well as nonnative species (Rieman et al., 2003; Fausch et al., 2006). A Bayesian belief network (BBN) was developed to analyze the trade-offs between threats of invasion by nonnative brook trout and isolation of native WCT populations (Peterson et al., 2008). The BBN accounts for physical habitat quality and size of streams, interactions between the two trout species, and the effects of barriers on isolated populations, The BBN functions at the stream network scale using averages of environmental variables and results in the probabilities of a 20-yr persistent population of WCT being present or extinct in the selected stream network (Figure 1).
 
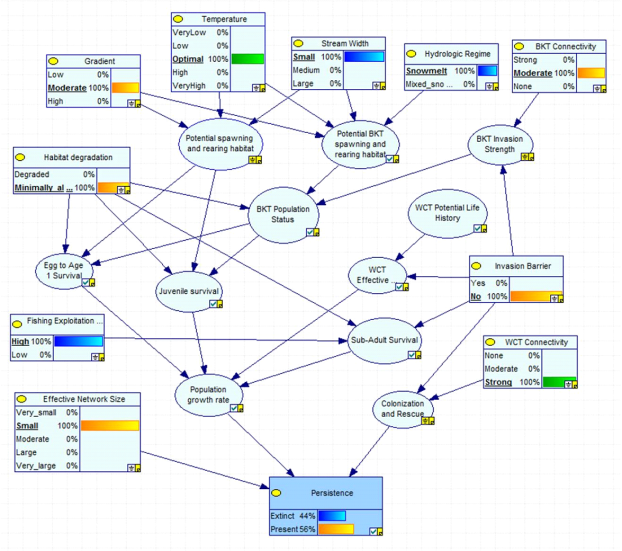
 Figure 1. Bayesian network to calculate the trade-offs between threats of invasion by non-native brook trout (BKT) and intentional isolation for native westslope cutthroat trout (Peterson et al. 2008).
 
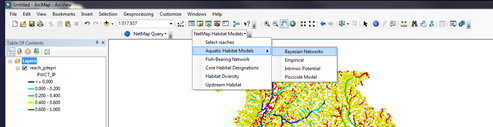
The WCT BBN is implemented in the NetMap Habitat Add In under Bayesian Models \WCT Invasion-Isolation model (Figures 2 a and b).
 
(a)
 
 
(b)
 
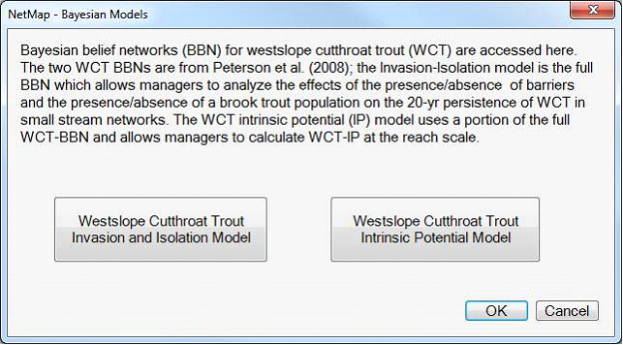
Figure 2. NetMap Aquatic Habitat Menu showing (a) the Habitat Models menu and (b) the Bayesian Networks window.
 
The WCT BBN has 11 inputs and the user selects the reaches that comprise a small stream network with attributes for reach gradient (m/m), stream width (m) and reach length (m) (Figures 1 and 3).  The WCT BBN uses wetted width as input, but the user can select an attribute for bankfull width or wetted width.  If bankfull width is selected, it will need to be converted to wetted width. A linear regression equation (R2 = 0.61; p = 2.20E-16) to convert bankfull to wetted width was developed for stream reaches surveyed by the Kalispel Tribe Initiative (KTI).
 
The KTI stream width equation is the default but model users can supply an intercept and coefficient that fit their data.  The model determines the effective network size in three ways:  by using the reach length field to calculate the sum of total network length; by using the count of WCT in the stream network from a reach attribute; or by using a constant state count of WCT from the dropdown list. The model assumes that the user has selected a stream network and not disconnected reaches –this is not checked! Note that a network will be selected if NetMap reaches and the NetMap Habitat Models \Select Reaches tool are used.
 
Inputs on the right side of the user interface window all provide constant states which are selectable by the user from the drop-down boxes (Figure 3). The list of states for each input is determined by the authors of the WCT BBN and a description of each is found in Table 1 below and in Peterson et al. (2008) with more development details in the supplements.
 
 
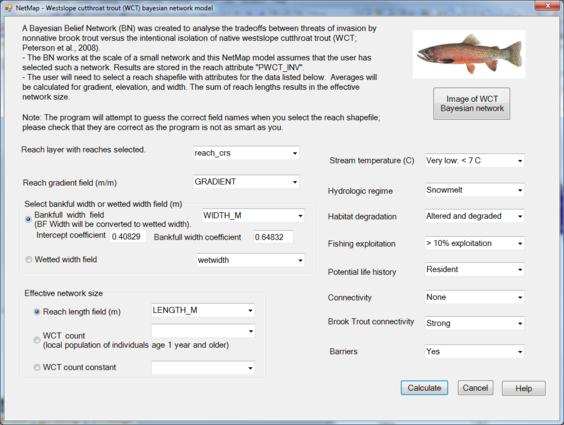
Figure 3. User interface for the NetMap westslope cutthroat trout invasion-isolation Bayesian network model.
 
The WCT BBN stores the result, which is the probability of a WCT population being present and persisting for 20 years, in the reach attribute “PWCT_INV”; this attribute is automatically mapped after calculations are complete. Note that there is only one average value for each stream network. The entire reach shapefile will be mapped so if you have completed several runs of the WCT BBN in different locations, all values will be shown.
 
Table 1.Node definitions and states for the isolation and invasion analysis and decision Bayesianbelief network (Source: Peterson et al., 2008). BKT = non native Brook Trout
 
 
Node namea
Definition
State
Temperature (I)
Mean summer water temperature over the stream network from 15 July to 15 September
Very low: <7oC                                     Low: 7-10oC                                 Optimum: 10-15oC                               High: 15-18oC                                      Very High: >18oC
Gradient (I)
Mean percent gradient over the stream network
Low: <2%                                    Moderate: 2%-8%                               High: >8%
Stream width (I)
Mean wetted width over the stream network during base flow
Small: <3m                                    Medium: 3-10m                                 Large: >10m
Hydrologic regime (I)
Seasonal patterns of runoff and flooding that might influence bed scour and subsequent incubation or emergence success of fall spawning salmonids like BKT
Snowmelt                                          Mixed rain-on-snow and snowmelt
Potential spawning and rearing habitat
The potential for successful reproduction and early rearing by WCT based on the physical template for natal habitat as influenced by stream gradient, summer water temperature, and stream size (width)
Low                                              Moderate                                              High
Potential BKT spawning and rearing habitat
The potential for successful reproduction and early rearing by BKT based on the physical template for natal habitat as influenced by stream gradient, summer water temperature, stream size (width), and the dominant hydrologic regime
Low                                              Moderate                                             High
Invasion barrier (I)
A natural or human-constructed barrier that precludes upstream movement by stream fishes
Yes                                                       No
BKT connectivity (I)
The potential for invasion by BKT into the local stream network based on the magnitude and frequency of BKT immigration as influenced by the number, distribution, and attributes of potential source BKT populations outside the local stream network and the characteristics of the movement corridor
Strong                                          Moderate                                            None
BKT invasion strength
Realized or effective “BKT connectivity” as influenced by whether or not an invasion barrier is present or will be installed
Strong                                            Moderate                                            None
Habitat degradation (I)
Whether salmonid habitat and the processes that create and maintain it have been altered by human activity
 
Altered or degraded                        Minimally altered or pristine
 
 
Node namea
Definition
State
BKT population status
The potential strength of a BKT population in a stream segment as influenced by the realized condition of natal habitat and the likelihood of BKT immigration
Strong                                               Weak                                                Absent
Fishing exploitation (I)
Fishing exploitation rate of subadult and adult (aged 2 and older) WCT in a stream network
Low: <10% annual exploitation                     High: >10% annual exploitation
Egg to age-1 survival
WCT survival from egg to age 1 as influenced by realized habitat conditions and interactions with nonnative BKT
Low: <2.5%                                  Moderate: 2.5%-5%                             High: >5%
Juvenile survival
WCT survival from age 1 to age 2 as influenced by realized habitat conditions and interactions with nonnative BKT
Low: <25%                                   Moderate: 25%-35%                            High: >35%
Subadult-adult survival
Annual survival of subadult and adult WCT (ages 2 and older) as influenced by realized habitat conditions, fishing, and presence of an invasion barrier
Low: <35%                                  Moderate: 35%-45%                            High: >45%
Potential life history (I)
The potential expression of migratory and resident life histories for WCT in a stream network; the potential influence of life history expression on the resilience of WCT is assumed to be primarily through the differential reproductive contribution of distinct migratory forms
Resident (low fecundity)                 Migratory (high fecundity)
Effective life history
Actual life history expression based on a “potential life history” and whether or not an invasion barrier is planned or installed (i.e. migratory life history is lost with installation of barrier)
Resident (low fecundity)                  Migratory (high fecundity)
Population growth rate
The potential finite rate of population increase (lambda or λ) for the local population of WCT as influenced by reproductive success and recruitment, stage-specific survival rates, and fecundity based on the predominant life history; the node defines population growth potential in the absence of density dependence and environmental variation
Very low: λ <0.85                                       Low: λ = 0.85-0.95                                      Moderate: λ = 0.95-1.05                              High: λ = 1.05-1.15                                     Very High: λ>1.15
Connectivity (I)
The potential for immigration and demographic support for a local population of WCT based on the distribution, interconnection with, and independence of surrounding populations present in other stream networks; it is influenced by the expression of migratory life histories, barriers of movement, and the distribution and characteristics of neighboring populations
None                                            Moderate                                          Strong
Colonization and rescue
Realized or effective connectivity of WCT as influenced by “connectivity” and whether or not an invasion barrier is planned or installed
None                                            Moderate                                          Strong
 
 
Node namea
Definition
State
Effective network size (I)b
Size or spatial extent of the local population and its vulnerability to environmental variation and catastrophic events; we use population size (age 1 and older) as our primary metric for the analysis, but assume that population size and network size (km) are directly related
Very small: <3 km,  <500 WCT             Small: 3-5 km, 500-1000 WCT         Moderate: 5-7 km, 1000-2500 WCT  
Large: 7-10 km, 2500-5000WCT        
Very large: >10km, >5000
Persistence
The presence of a functionally viable local WCT population for at least 20 years
Absent                                            Present
 
Note: Nodes that refer specifically to brook trout (BKT, Salvelinus fontinalis) population ecology are so noted (e.g., potential BKT spawning and rearing habitat, BKT invasion strength). Nodes without a species designation refer either specifically to westslope cutthroat trout (WCT, Oncorhynchus clarkii lewisi) population ecology (e.g., fishing exploitation, potential spawning and rearing habitat, juvenile survival, persistence) or variables with a common influence on both species (e.g., temperature, habitat degradation, etc.). Details regarding definition of the nodes and information used to develop the associated conditional probability tables are in Supplemental Appendix S14.                                                                                                                                                                                                                                                                                                                                                                                                                                                          ainput nodes (I) are those where the BBN user designates the prior probability of being in a particular state.                                                                                                                                                                                                                                                  b Effective network size” can be expressed as either length (km) of connected spawning and rearing habitat in a local stream network or the population size of individuals age 1 and older (age 1+) within the stream network.


Made with help of Dr.Explain

Copyright TerrainWorks 2014