| < Previous page | Next page > |
Reach Gradients/Set Fish DistributionCALCULATE CHANNEL GRADIENTS
NetMap Module/Tool: Analysis Tools/Calculate Channel Gradients
Model Description:
This tool allows a user to recalculate channel reach gradients over specified lengths scales and also according to a drainage area threshold. For example, one length scale can be specified above an area threshold and another length scale can be specified below an area threshold. This could be useful when identifying fish barriers that have a channel gradient threshold that is applied over different length scales depending on location in a basin. Consider fish passage barriers (for example, an 8% gradient for salmonids). A short section of 8% channel gradient (say 10 m) might be surmountable for fish passage. However, if the 8% gradient went on for a couple of hundred meters, that might pose a fish barrier.
Channel gradients can be calculated over any length scale without a drainage area threshold. In addition, the tool allows analysts to identify waterfall barriers. It also allows a user to recalculate the maximum downstream gradient, which is used to identify the fish bearing network. Although maximum downstream gradient is typically a node based value (see channel nodes in NetMap's synthetic stream layer), at times users like to view the maximum downstream gradient in the reach shape file, which can be done with this tool. The default channel gradient calculation in NetMap uses a dynamic window length that ranges from 500 m in lower, less steep areas of valleys (~0.001) to 50 m in the steeper portions of valleys (~0.20).
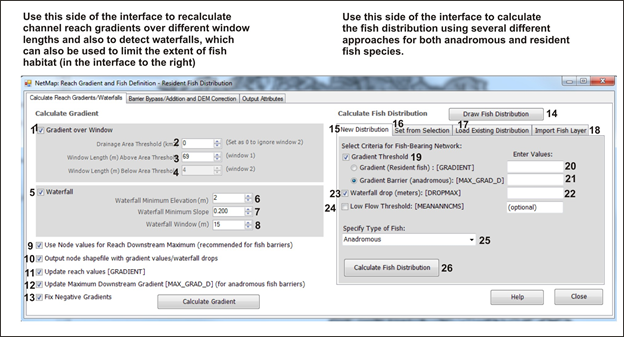 Figure 1. (1) Channel gradients can be calculated over any length scale. (2) An area threshold can be specified and then separate length scales (windows) can be indicated for above and below the area threshold (3, 4). (5) Waterfall fish barriers can be identified by indicating a minimum elevation drop over a length scale determined by specifying a minimum slope (6, 7). (8) When identifying waterfalls, a length window must be selected. (9) Nodal synthetic stream network values (see node based network in NetMap) are recommended when searching for fish barriers. (10) The node based stream layer can be an output (see Figure 3). (11) The calculations done with this tool can be used to update the reach values in the stream shapefile. (12) Or, only the maximum downstream gradients can be replaced in the reach shape file. (13) In some NetMap datasets, there can be negative channel gradients that reflects errors or anamolies in the DEM. Negative gradients that impact certain tools like Beaver Habitat or Stream Power are automatically corrected, using a average of upstream and downstream positive gradients nearest to the channel reach with the negative gradients. However, negative gradients may persist in the reach attribute table in ArcMap, and in that case, the negative gradients can be adjusted to positive values by checking #13; the correction is made by averaging upstream and downstream positive gradients nearest to the channel reach with the negative gradients.
On the right hand panel, a user can specify the elements of the fish distribution (15), or a user can define a fish distribution across only a selected set of channel reaches (16). One can load an existing fish distribution (17), or import another fish layer from which to inform (match) NetMap's fish distribution (18). A gradient barrier for anadromous or resident fish is selected (19) along with specified threshold values (20-21). Resident fish can occur upstream of a specified gradient barrier whereas anadromous fish are limited in extent to below a specified gradient barrier. Waterfall drops can be added as a fish barrier (22-23) but that requires running the waterfall tool on the left side panel of the interface (#5). A low flow threshold can also be specified (24). The type of fish distribution is selected (25) and that gets indicated on all of NetMap tools (e.g., resident or anadromous and by species available in the drop down list). The tool is then run (26).
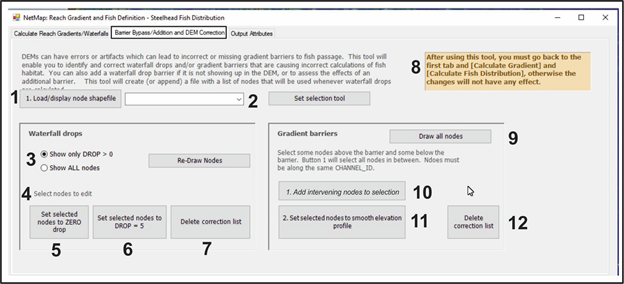 Figure 2. The "Barrier Bypass/Barrier Addition and DEM correction" tool tab allows one to select the node shapefile (1 and 2) (that underpins the synthetic river network at the scale of the DEM) and then to show all waterfall drops > 0 or show all nodes (3). The nodes that need correction (say due to problems with the DEM) are selected (4). Then those nodes (which might + or - elevation changes, but spurious) can then be set to zero drop (5), that way, repairing the nodes that were given wrong values due to problems with the DEM. Or, if an analyst wanted to ADD a fish barrier where none exists in the DEM (for example a dam in a 10 m DEM), the a user can select the node location and set the drop to 5m (6), thereby adding a barrier (or more than one). IMPORTANT: after changing node values in any way, one must return to the "calculate reach gradients/waterfalls" tab and run both the left and right side panels to re-calculate gradients and fish distributions (8). Similarly, gradient barriers (longer channel reaches with steeper gradients) can also be bypassed. (9) All channel nodes are drawn. (10) After identifying the gradient barrier you wish to bypass, select some nodes above and below the barrier. Then, the intervening nodes between the above and below nodes are selected. (11) All the nodes are then selected to smooth the gradient profile and remove the barrier. (12) Deletes the correction node list.
The final tab (Output Attributes) shows the attributes created by this tool.
 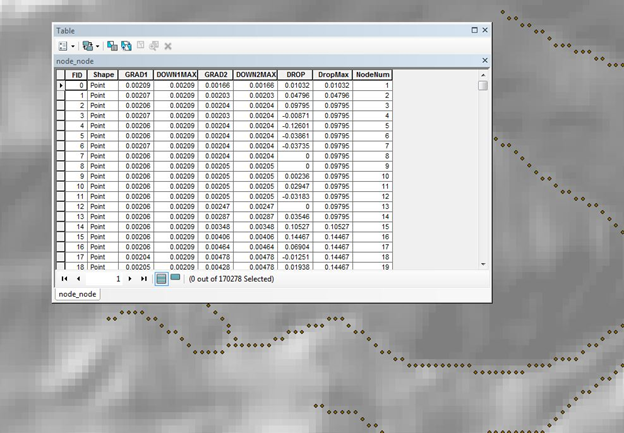 Figure 3. NetMap's node based stream layer with attributes.
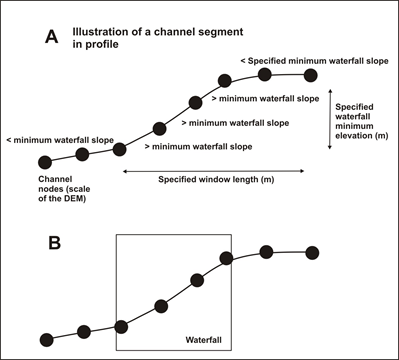 Figure 3. A waterfall is initiated when the node-to-node slope exceeds the WATERFALL MINIMUM SLOPE and the change in elevation over the upstream WINDOW LENGTH exceeds the WATERFALL MINIMUM ELEVATION. The waterfall flag continues until the node-to-node slope is less than the threshold and the elevation change over the upstream window is less than the elevation threshold and, if you included CHECK SLOPE, the maximum node-to-node slope over the upstream window is less than the slope threshold.
|