| < Previous page | Next page > |
7.2 Climate Change VulnerabilityClimate Change Vulnerability Tool
Parameter Description: NetMap's Climate Change Vulnerability tool is used to display and evalute the downscaled climate change predictions involving air temperature, precipitation, snowmelt, snow-water-equivalent, and summer and winter runoff (stream flows). The tool provides an efficient means to quickly locate the greatest forecasted changes in climate. Predictions in NetMap are reported in percent (%) change from historical (1916-2006) to forecasts in 2040 (positive and negative values); however, the air temperature predictions are in absolute change in degrees C. The tool is also used to quickly search for landscape vulnerability to climate change by examining intersections among climate change, wildfire risk, and in-stream habitat and channel sensitivity indicators (using any percentile of the distribution). Note, that although temperatures are reported to reach segments and aggregated downstream, the data represent air temperatures and not water temperatures.
The scenarios represent a composite average of ten global climate models (GCM) for the western US using four bracketing scenarios based on four GCMs (ECHAM5, MIROC_3.2, HADGEM1, and PCM1). Predictions are for one greenhouse gas scenario (A1B, a middle of the road scenario for future emissions). Results are in percent change from historical (1916-2006) to forecasts in 2040. Forecasts were obtained from University of Washington Climate Impacts Group. For additional background information on how forecasts were made, see here and here.
Data Type: Grid (Raster); Line (stream layer)
Temperature
Field Name: tavg; Common Name: Hist-2040 JJA temp chg degC (Grid)
Field Name: tdif_l; Common Name: Hist-2040 JJA temp chg degC-segment scale (reach)
Field Name: tdif_c; Common Name: Hist-2040 JJA temp chg degC-averaged downstream (reach)
(JJA = June, July, August)
Precipitation
Field Name: prdif; Common Name: Average precipitation-percent change (Grid)
Field Name: prdif_l; Common Name: Hist-2040 precip %change-segment scale (reach)
Field Name: prdif_c; Common Name: Hist-2040 precip %change-averaged downstream (reach)
Snow Accumulation
Field Name: nday; Common Name: Average number of snow accumulation days-percent change (grid)
Field Name: nday_l; Common Name: Hist-2040 snow accum days %change-segment scale (reach)
Field Name: nday_c; Common Name: Hist-2040 snow accum days %change-averaged downstream (reach)
Summer Runoff (flow)
Field Name: fdsum; Common Name: Average summer flow-percent change (grid)
Field Name: FDSum_l; Common Name: Hist-2040 summer flow %change-segment scale (reach)
Field Name: FDSum_C; Common Name: Hist-2040 summer flow %change-averaged downstream (reach)
Winter Runoff (flow)
Field Name: fdwin; Common Name: Average winter flow-percent change (grid)
Field Name: FDWin_l; Common Name: Hist-2040 winter flow %change-segment scale (reach)
Field Name: FDWin_C; Common Name: Hist-2040 winter flow %change-averaged downstream (reach)
Snow-Water-Equivalent-ratio (average)
Field Name: swerat; Common Name: Average snow-water equivalent ratio (grid)
Field Name: swerat_l; Common Name: Hist-2040 SWE ratio %change-segment scale (reach)
Field Name: swerat_c; Common Name: Hist-2040 SWE ratio %change-averaged downstream (reach)
Snow-Water-Equivalent-ratio (maximum)
Field Name: swemx; Common Name: Average maximum snow-water equivalent (grid)
Field Name: swemx_l; Common Name: Hist-2040 SWE maximum %change-segment scale (reach)
Field Name: swemx_C; Common Name: Hist-2040 SWE maximum %change-averaged downstream (reach)
Units: Percent Change (%, decimal)
NetMap Module/Tool: Vegetation/Fire/Climate -Climate Change Vulnerability
Model Description:
The tool interface is shown in Figures 1 and 2. When the Climate Change vulnerability tool is first used in a NetMap dataset, a user must download the climate change files (#1, Figure 1). The user must then "route" (#2) the grid (raster) data into the channel network (segment scale, via Drainage Wings) and downstream. Values downstream represent a running average. A user than uses the drop down list (#3) to display: a) any of the gridded data (temperature, precipitation, snow accumulation, snow-water-equivalent), summer flow and winter flow), b) the channel segment scale version of those (fish eye view), and c) a running average of those values downstream.
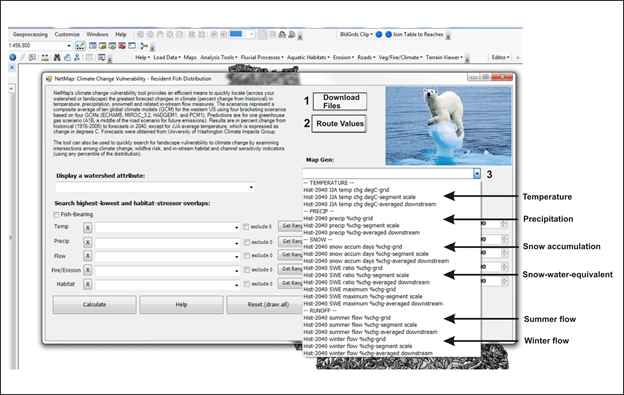 Figure 1. The Climate Change Vulnerability Tool.
A key element of the Climate Change vulnerability tool is the ability to search for any percentile of the predicted climate change (e.g., top 50%, 10%, 1% etc.). In addition, a user may search for overlapping stressors at any percentile of the distribution (say top 10% of temperature increase with top 10% of summer flow reduction). With up to four overlap options, a user can search for many combinations of climate change stressors and fire, erosion and aquatic habitats.
An analyst first selects a parameter for display (4, Figure 2). Next, they can select any combination of one to four parameter types (temperature, precipitation, flow, fire/erosion and habitat (5, Figure 2). If there are zeros (0) in the data, a user can optionally remove those from the distribution (6). A range of values can be displayed (7) in the window (8). A drop down window (9, and see Figure 3) is used to select from any portion of the distribution. Note, that if predicted climate change values are negative (such as summer flow for example), then if a user wishes to search for and display the highest 10% of the negative values (for example < some negative value), then one must sample from an "inverted distribution" (10). Then a user MUST calculate a threshold (#11). Press "calculate" (13, Figure 2) to view the results (in the display, using the attribute chosen (4).
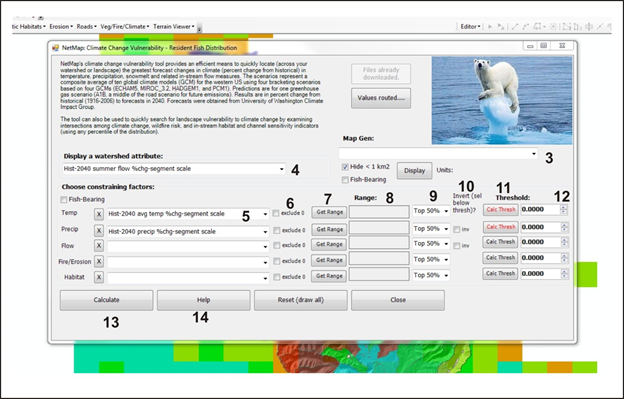 Figure 2. The Climate Change Vulnerability Tool.
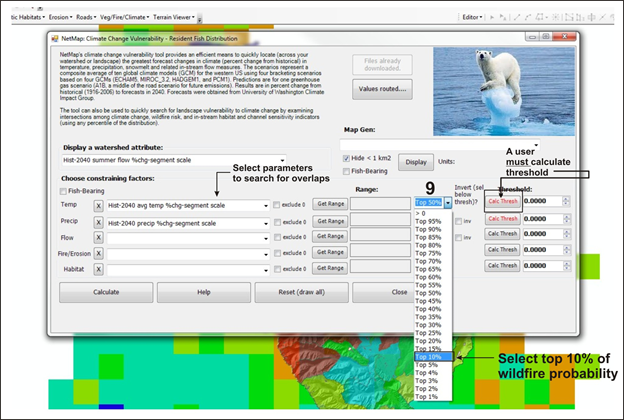 Figure 3. The Climate Change Vulnerability Tool.
Example Application:
NetMap’s tool is used to search for landscape vulnerability to climate change by examining intersections among climate change, wildfire risk, and in-stream habitat and channel sensitivity indicators in the Flathead River basin in Montana (US Fish and Wildlife Service). Forecasts pertaining to mean annual temperature, precipitation, snow accumulation, and summer and winter flows are presented. Forecasts are available for both the US and Canadian portions of the Flathead River watershed. Additional background information is available from Littell et al. (2011).
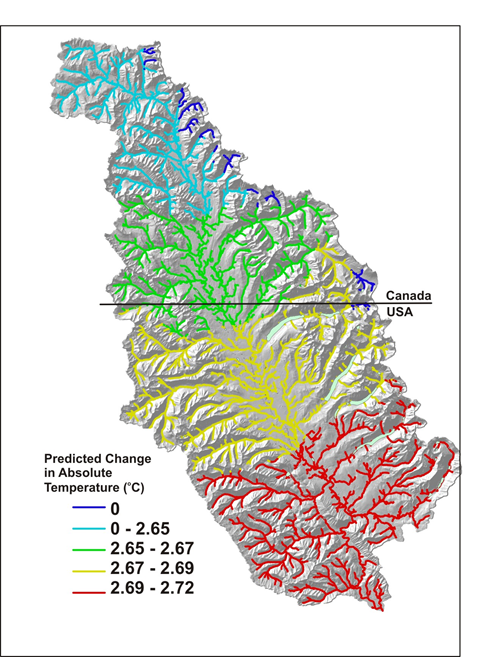 Figure 4. Downscaled predictions for mean annual air temperature mapped as absolute increase (deg C) from year 2040 compared to historical (1916 – 2006). Although the raw data are in grid form, NetMap converts those values to channel segment values.
The downscaled climate change predictions also reveals that average annual precipitation may increase (rain and snow combined), although non-uniformly across the watershed (Figure 5). However, GCM predictions do not consider orographic effects of westerly winds and these are decreasing, leading to declines in mountain precipitation and thus to potentially lower flows (Luce et al. 2013).
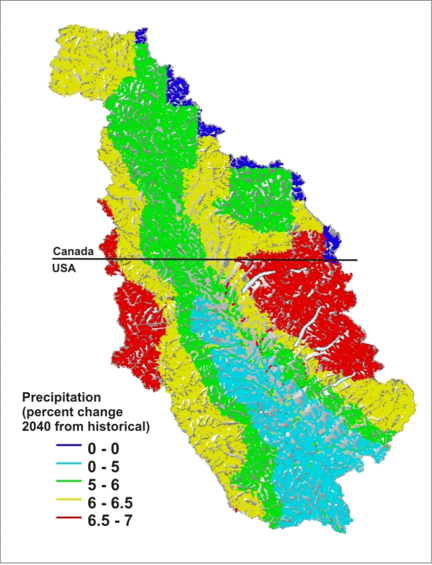 Figure 5. UW Climate Impact Group GCM projections (downscaled) reveal a spatially variable increase in annual precipitation across the Flathead River watershed.
Wildfire is an important environmental stressor in the Flathead River watershed and the incidence of fire may increase in a warming climate. NetMap’s climate change vulnerability tool is used to search for locations where the highest 10% of projected reductions in summer flow overlap the highest 10% of present day fire severity (Figure 6).
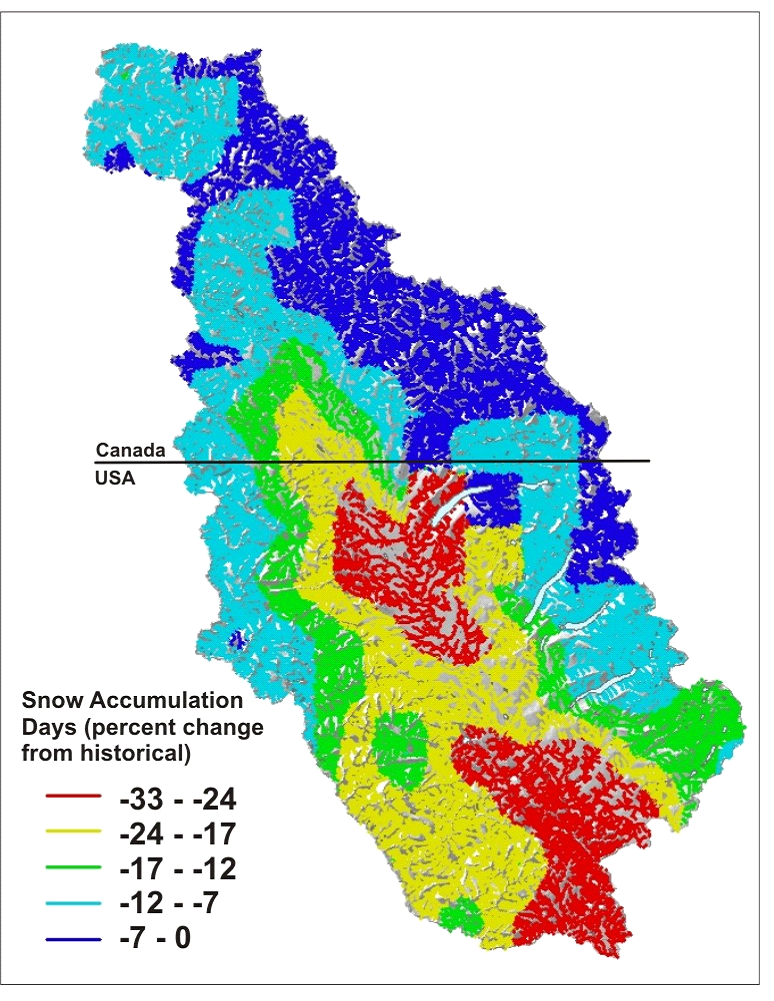 Figure 6. NetMap’s climate change vulnerability tool is used to identify locations in the Flathead River watershed where the highest 10% of climate change induced reductions in summer flow overlap the present day highest 10% of fire severity (flame length). Such potentially sensitive areas are concentrated in the southwestern portion of the basin on the US side of the border (no fire risk data in Canada was used in this analysis).
Downscaled climate change projections also reveal significant reductions in snow accumulation days across the watershed, with the highest predicted reductions in the US side of the border. The forecasts defines elevation bands surrounding the N-S Flathead River mainstem with reductions that increase from higher to lower elevations ranging from less than a few percent to a maximum of greater than 30% along the mainstem in the US portion of the basin (Figure 7).
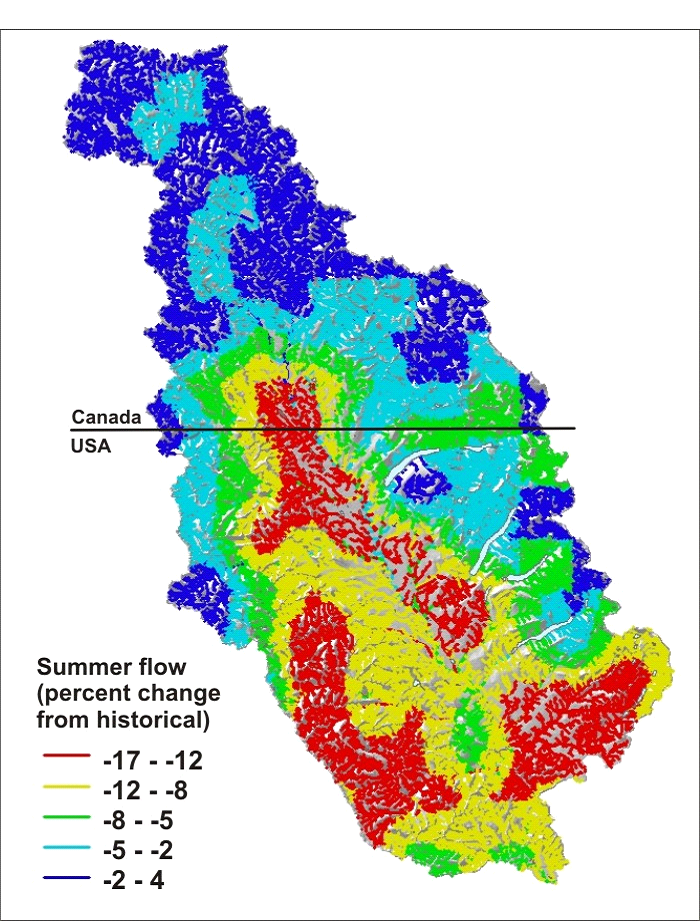 Figure 7. UW Climate Impacts Group climate change forecasts for reductions in snow accumulation days in the Flathead River watershed.
Total precipitation is forecasted to increase across the Flathead River watershed due to climate change (although modestly to a maximum of 7% by 2040). However, the significant change in winter precipitation as snow (Figure 8) leads to forecasted reductions in summer runoff of up to 12 to 17% (Figure 8). But see the recent work of Luce et al. (2013) on decreased orographic effects leading to reduced flows in the northwestern US.
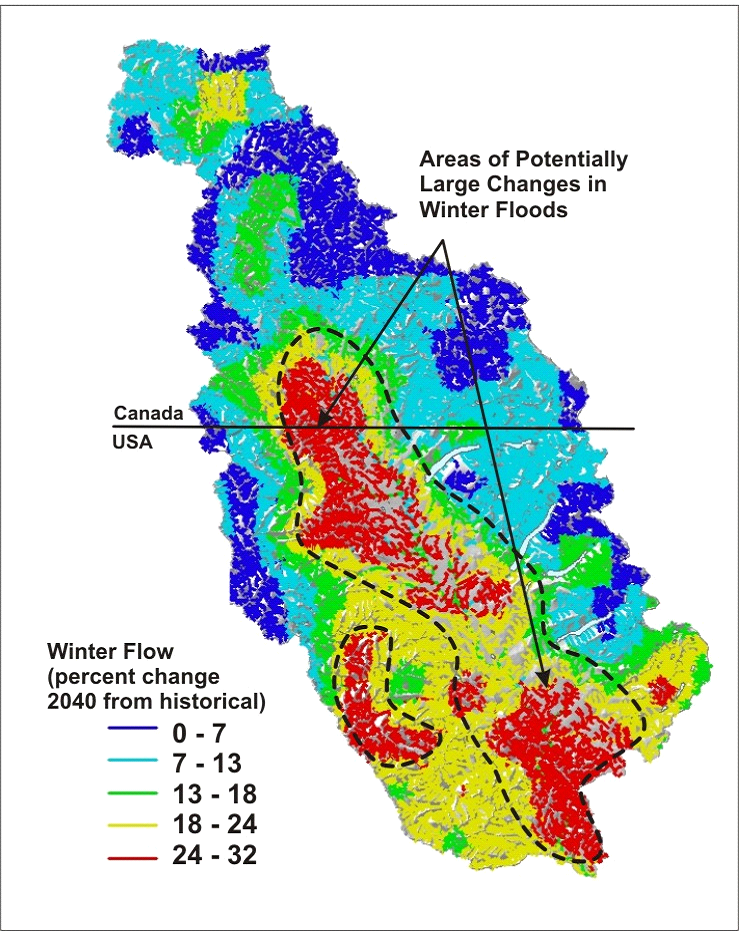 Figure 8. UW Climate Impacts Group predictions of reductions in summer flow show the largest impacts occurring in the US side of the border and along the lower western and eastern basin boundaries.
The predicted conversion of winter snow to winter rain (Figure 7) due to a warming climate (Figure 38) in the Flathead River watershed can result in increases in winter flows (Figure 9). This could yield an increase in rain dominated floods or rain-on-snow floods with the greatest potential impacts along the mainstem river and adjacent lowland tributaries.
 Figure 9. UW Climate Impacts Group forecasts for increases in winter flow. The largest changes are forecast for the mainstem and adjacent lowland tributaries on the US side of the border.
|