| < Previous page | Next page > |
ChannelShallow Landslide Intensity - Channel (Fish-Eye View of Erosion Potential)
Parameter Description: The susceptibility of hillslopes to shallow failure and to gullying based on an empirically calibrated model (Miller and Burnett 2007) utilizes a topographic index (GEP) combining slope steepness with slope convergence with a landslide inventory. This reach parameter summarizes shallow landslide intensity as viewed by individual channels segments. See Shallow Landslide Potential-Hillslope for more details.
Important Notice: This erosion model is calibrated for the Oregon Coast Range. Thus when used outside of that landscape, the model should be considered as a screening tool that provides a relative ranking of instability potential(e.g., low - high). Although the model employs universal topographic indicators of shallow landslide potential increased accuracy and resolution can be obtained when shallow landslide density model is calibrated using local data (georeferenced locations of landslides or gullies). A landslide calibration tool is planned for NetMap in later 2014. Also see Warning about using Slope Stability Models.
Data Type: Line
Field Name: LS; Common Name: Shallow Landslide_Segment
Field Name: LS_cum; Common Name: Shallow Landslide_aggregated (downstream, averaged - area normalized)
Field Name: LSDEL; Common Name: Shallow Landslide_Delivery
Field Name: LSDEL_CUM; Common Name: Shallow Landslide_Delivery, Cumulative (aggregated downstream)
Units: Numerical values, range from 0 to >1
NetMap Module/Tool: Erosion Module/Shallow Landslide Intensity
Model Description: Values for Shallow Landslide Intensity (hillslope grid) are summarized within individual ‘drainage wings’ on both sides of the channel and summarized as a reach attribute (Shallow Landslide_segment). Segment GEP values are then aggregated downstream (Shallow Landslide_aggregated) revealing a channel eye view of hillslope erosion potential at any watershed scale defined by the stream network.
NetMap’s aggregation tool reports shallow landslide intensity to individual stream segments and also routes that information downstream. In NetMap, each channel segment’s local contributing drainage area is defined on both sides of the channel (called drainage wings, Figure 1) and information contained on those hillsides (such as Landslide Intensity) is reported to the channel segment (Figure 2). That information is then routed downstream.
Landslide Intensity is a multiple of a landscape average landslide density (number of landslides/km2). Although Landslide Intensity is a calibrated index using data from the Oregon Coast Range, the non linear relationship between landslide density and topographic controls on shallow failure (here for more info) that likely extends to other landscapes, allows the Intensity parameter to be applied elsewhere, although as a relative index (high-low intensity). Stream segment scale and aggregated downstream values of landslide susceptibility can be used in other NetMap tools, for example when searching for overlaps between high erosion potential and quality fish habitats (Figure 3).
 Figure 1. NetMap applies a universal data structure to all of its watershed analyses. This involves organizing river networks into stream segments (with Ids), confluence nodes, and local contributing drainage areas. Hillslope and channel information is routing downstream revealing patterns across multiple scales.
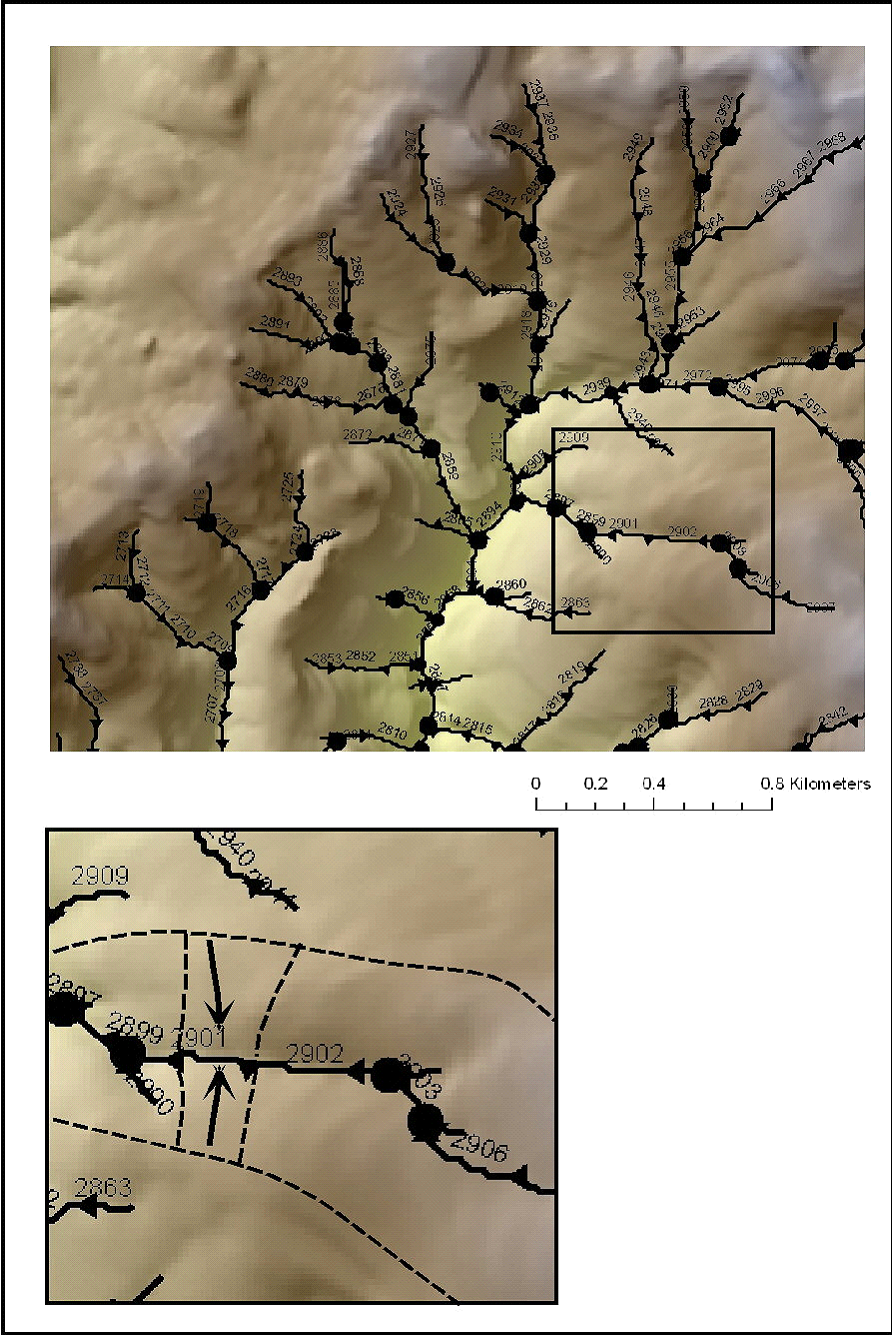 Figure 2. In NetMap, certain hillslope parameters are aggregated into the nearest and downslope stream channel segment (1) so that they can be used with other NetMap tools. NetMap determines the contributing hillslope area that drains into channel segments (on both sides of channels) that range in length from 20 to 200 m (2). The algorithm then determines the amount of road length that intersects those contributing areas and calculates a channel segment-based road density (km km-2) (3). NetMap also calculates similar densities for erosion potential (GEP), shallow landslide potential, and fire risk (or burn severity). NetMap also aggregates segment-based values downstream throughout a river network, yielding drainage area weighted values for road density, erosion density, landslide potential density, forest age, and fire risk (or burn severity) density. This is used in the SeFieldh for Overlaps tool.
 Figure 3. NetMap contains a tool for reporting the parameter of Landslide Intensity to individual channel segments (Top) and then aggregates (routes) that information downstream (Bottom). This reveals patterns of landslide susceptibility at any spatial scale defined by river networks in watersheds.
|