| < Previous page | Next page > |
Tributary Confluence DensityTributary Confluence Density
Parameter Description: Confluence density, defined as number of tributary confluences per area (km2) or the sum of confluence effects probabilities per unit area.
Data Type: Polygon
Field Name: JuncDens; Common Name: Junction Density
Units: #/km2 or sum of confluence probabilities per unit area (see Confluence Environments Parameter).
NetMap Module/ Tool: Fluvial Processes/Drainage and Junction Density
Model Description:
Confluence density in NetMap is calculated at the scale of subbasin polygons. NetMap generally comes bundled with HUC 6th subbasins, but a user can import their own (custom) subbasin boundaries (refer to the “import data” tool in NetMap’s Basic Tool Module).
Confluence density is generally calculated for all channels in a network. In NetMap’s density tool, a user first defines whether the analysis will occur on the total network or only on a subset of the network, defined by a previous attribute query (1, Figure 1). Next, the junction density can occur over the entire network or only the defined fish-bearing portion of the network (2, Figure 1). Junction density option is selected (3, Figure 1). If the density calculation is applied only to “selected” objects, then the junction density applies to channel segment-based attributes, such as channel gradient and valley widths, etc. In contrast, the density calculation can be applied only to confluence-based attributes (i.e., confluence probabilities or debris flow susceptibilities-junctions).
Technical Background
Confluence related effects at, and near junctions, result in creation of terraces and wide floodplains (Small 1973, Grant and Swanson 1995, Schmidt and Rubin 1995), formation of channel meanders and braids (Benda 1990; Church 1983), changes in bed substrate (Rice et al. 2001, Benda et al. in press) including creating boulder deposits and rapids (Wohl and Pearthree 1991, Meyer et al. 2001), deeper and wider channels (Best 1986; Benda et al. in press), mid-channel bars (Best 1986), ponds (Everest and Meehan 1981), and log jams (Hogan et al. 1998) (Table 1). Morphological effects of junctions are most pronounced in lower-gradient portions of rivers and may decline in steep, narrow valleys where high stream energy quickly erodes fans or in wide valley floors where fans are isolated from mainstem rivers (Benda et al. in 2004a,b).
Tributary junctions can constitute areas of special geomorphic significance, including contributing to biological hotspots (see Confluence Environments in NetMap’s Fluvial Morphology Module). Variation in confluence density should translate to a corresponding variation in the density of channel junctions with implications for the degree of channel heterogeneity found in different landscapes (for additional background, see Benda et al. 2004,a,b among citations in the reference section). Thus, subbasin’s that have the highest junction density may also have significant biological potential and may even be more physically and perhaps biologically diverse, other things being equal.
With respect to tributary junctions, the density can apply to simply the number per unit area or the calculation can be weighted by the predicted confluence probabilities (see Confluence Environments in Technical Help). The latter junction calculation may be more meaningful if the density calculation is done to consider the role of confluences within individual subbasins (Figure 2).
 Figure 1. NetMap’s density tool is used to calculate the spatial density of tributary junctions. The calculation is applied to the entire network or only to the fish-bearing portion. NetMap either calculates tributary junctions as simply #/area or weighted by predicted confluence probabilities (2). Also see NetMap’s ‘Drainage Density Tool’.
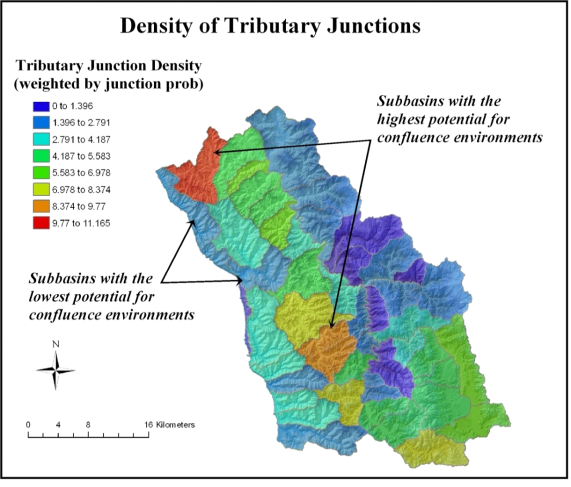 Figure 2. Tributary junctions are recognized hotspots for numerous geomorphic and ecological processes (see ‘Confluence Environments’ in the Fluvial Morphology Module). The distribution of geomorphically significant junctions is not uniformly distributed across watersheds and landscapes, but is sensitive to basin shape and network orientation (among other factors). NetMap includes a tool for calculating the density of confluences within subbasins by two different methods; shown is density weighted by the probability of confluence effects.
|