| < Previous page | Next page > |
IntroductionINTRODUCTION
NetMap: Desktop Watersheds and Tools for Resource Planning
Abstract
Resource management increasingly relies on detailed spatial information to design land use activities, anticipate effects of resource use, and design mitigation strategies. A desktop watershed provides a digital spatial framework in which landforms and physical processes are analyzed in context with patterns of resource use and human infrastructure. Analyses using desktop watersheds increase the site specificity and defensibility of resource planning at watershed to regional scales by private sector and government agencies while concurrently restraining costs of environmental assessments. This on-line Technical Help services the analysis tools and databases contained within NetMap.
Introduction
All countries face challenges in balancing natural resource use with environmental protection. Competitive forestry industries require effective silvicultural programs while implementing freshwater protection strategies. Oil, gas, and coal mining offer capital generation in international energy markets, but extractive energy industries need to incorporate environmental protection. Increasing need for agricultural products worldwide accelerates the parallel need to protect soils from erosion and water from pollution. The diversity of resource uses and the need for environmental protection and conservation lead to numerous questions that need to be answered with a high degree of spatial accuracy.
· Where, across a landscape, are the effects of forestry or agriculture on erosion and water pollution the greatest?
· At what specific locations do drilling wells and energy pipelines present the greatest risk to water quality and fisheries?
· Where do wildfires present the greatest risk to terrestrial habitats, water quality and municipal water supplies?
· Which areas are most susceptible to climate change and extreme weather?
These questions and numerous others involving resource use and risk mitigation are answered in different ways at different scales. In small- to moderate-sized areas (101 to 102 km3) in high-profile projects, environmental assessments can be intensive, requiring extensive field work, data compilation, and modeling. Detailed studies of oil sands mining in Alberta Canada focused on water quality, wildlife, stream ecology, and land remediation (Gosselin et al. 2010, Foote 2012). Assessment of the Elwha River dam removal in Washington State focused on sediment transport, channel morphology and salmon habitats, requiring a detailed environmental impact assessment (National Park Service [NPS] 2005). Detailed analyses are generally restricted to local geographic areas conducted by experts in consultancies, universities, and agencies. Intensive studies generally lead to site-specific recommendations, such as guidance on land remediation in Alberta and river restoration in Washington State.
Relatively small areas that have been studied intensively for resource planning exist within a sea of much larger areas at landscape to regional scales (>103 km2) that have either a limited accounting of environmental stressors or a generalized set of environmental policies. For example, the US National Forest System contains 47,000 km of mostly unpaved roads, and although they are known stressors to ecosystems affecting hydrology, soil erosion, and fish migration, their watershed-scale aggregate effects remain unquantified (Gucinski et al. 2001). In Canada and the US, most provincial, federal, and state environmental regulations addressing forestry and agriculture apply simple formulas of environmental protection (i.e., stream adjacent vegetation buffers along some portion of channel networks), even though such generalized approaches can lead to less efficient resource use and less effective conservation (Reeves 1995, Everest and Reeves 2007, Burnett and Miller 2007, Richardson et al. 2012).
The need for an environmental assessment procedure to address resource planning at large spatial scales (watersheds, landscapes, national forests in the US) led to a protocol called “watershed analysis” (WDNR 1992, Reid and McCammon 1993, Montgomery et al. 1995). Watershed analysis consists of a set of methodologies in technical disciplines (geomorphology, hydrology, riparian etc.) tailored to address effects of forestry on aquatic ecosystems. Much of the watershed analysis effort in the Pacific Northwest occurred prior to the proliferation of high resolution, remote sensed geospatial data (i.e., digital elevation models [DEMs]), numerical watershed process models (i.e., erosion, hydrology, fish habitats), and powerful computers. Hence, with its focus on historical conditions, watershed analysis was time and cost prohibitive and typically failed to provide high resolution, site specific analyses and management recommendations (Collins and Pess 1997). Thus, watershed analysis covered minimal areas and its use has declined over time.
Given increasing resource use pressures, such as forestry, energy development and agriculture in countries worldwide, including in the US, there is a growing need to increase the availability and utility of site specific environmental assessments in support of resource use planning at landscape to regional scales. Fortunately, there is increasing availability in geospatial data, models and software from which to conduct “desktop watershed analysis” to inform resource planning and conservation. A modernized version of watershed analysis, “NetMap’s” desktop system serves as a virtual environment in which physical and biological processes are evaluated in the context of resource uses (Benda et al. 2007, 2009).
NetMap consists of two major components: 1) desktop watersheds also referred to as Digital Hydroscapes and 2) analysis tools. These are used to develop automated desktop analyses to provide decision support to a range of resource use activities including: forestry, grazing, fisheries, wildfire planning, climate change, watershed restoration, conservation and research.
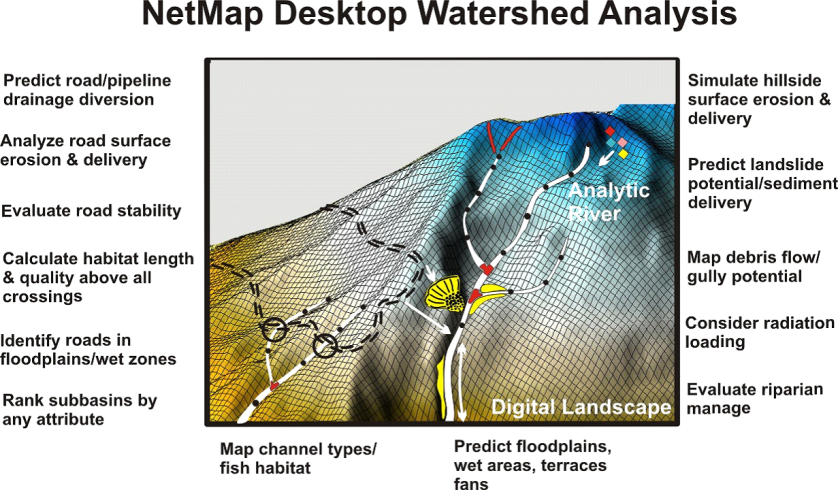 Figure 1. NetMap’s desktop watershed analysis consists of Digital Hydroscapes, inclusive of an analytic river network (e.g., stream layer), coupled to a suite of analysis tools. Desktop analysis provides a spatial framework in which landforms and ecological processes are analyzed in context with resource use activities and infrastructure. Numerous types of spatially explicit analyses can be conducted.
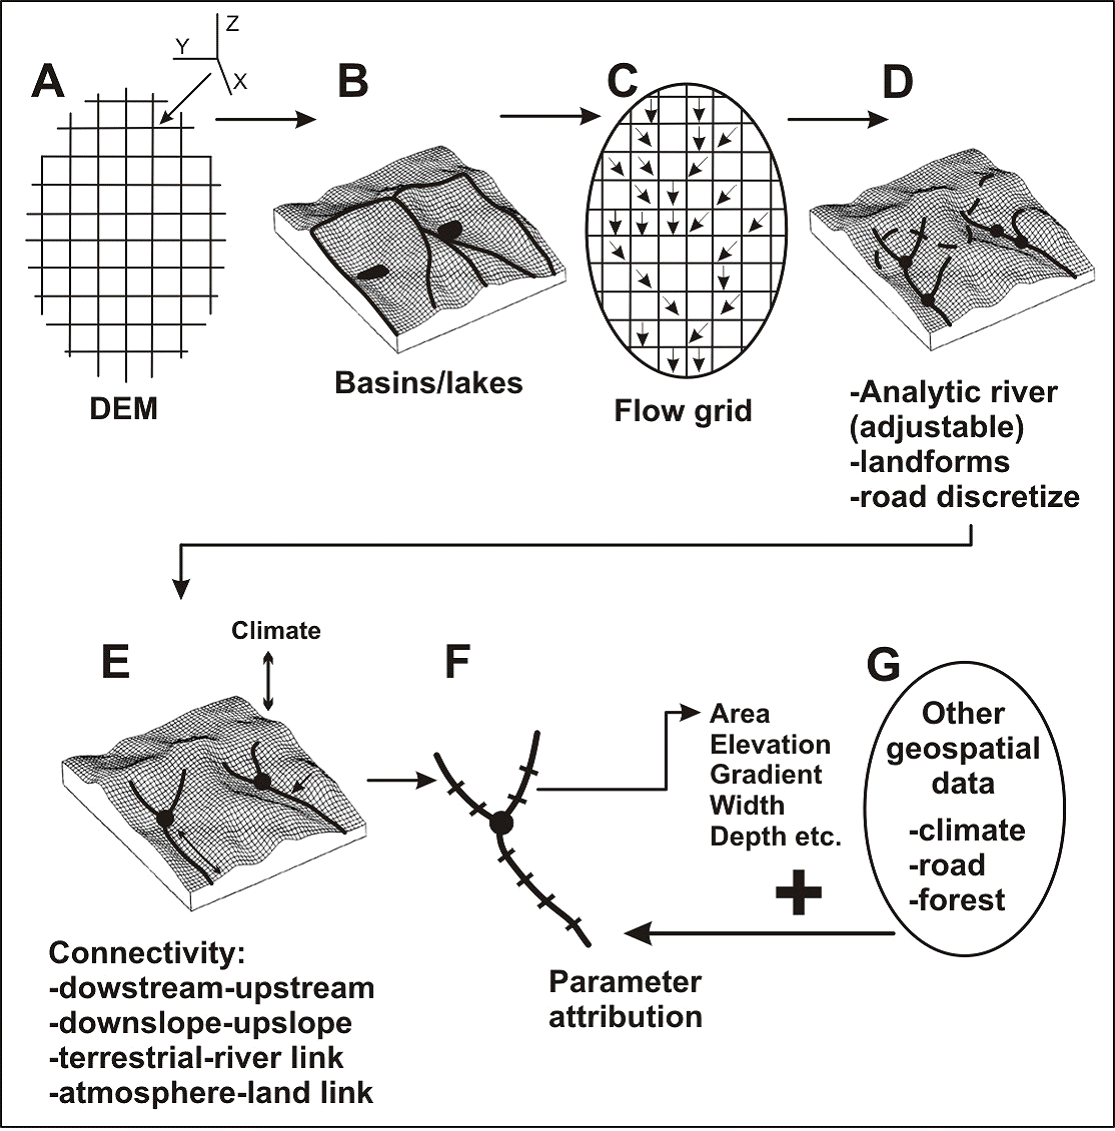 Figure 2. The Digital Hydroscape of a desktop watershed analysis is comprised of a series of elements including (A) DEM, (B) basin and subbasin boundaries and lakes, (C) flow direction grid, (D) an analytic river with segments set by the spatial grain of the DEM, (E) information connections include drainage wings that allow for the downstream-upstream and downslope - upslope transfer of information, and (F) parameter attribution of stream segments (Table 1). Additional geospatial information can be integrated into the Digital Hydroscape to support various types of environmental assessments (G). The Digital Hydroscape is coupled to a suite of watershed analysis tools (Figure 1).
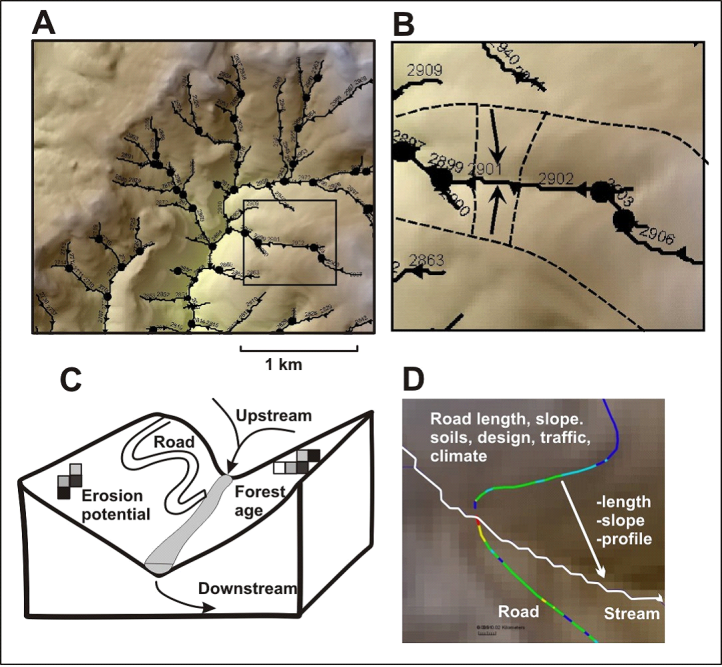 Figure 3. The Digital Hydroscape includes (A) a routed analytic river with confluences, including with attributes (Table 1). (B) Each segment has a right-left differentiated local contributing area or drainage wing (tenths of a square kilometer at segment length of 100m). (C) Information contained within drainage wings, such as erosion potential, fire risk and road length, is transferred to stream segments. Information can also be aggregated downstream, revealing patterns of channel and hillslope characteristics at any spatial scale defined by the channel network. Drainage wings support spatial analyses including identifying overlaps between terrestrial and riverine environments, including human related stressors (such as erosion, wildfire, roads etc.). (D) Roads (pipelines and power transmission lines) are broken at pixel borders to link road segments to pixel scale information on factors such as landslide potential; road pixel segments can also be re-aggregated to predict factors such as road drainage diversion potential.
Table 1. A wide range of physical and biological attributes (and their characterizations) can be associated with a Digital Hydroscape.
|