TODO: To change the footer's content go to Dr.Explain menu Options : Project Settings : HTML (CHM) Export : Setup HTML Template and Layout
Wood Recruitment
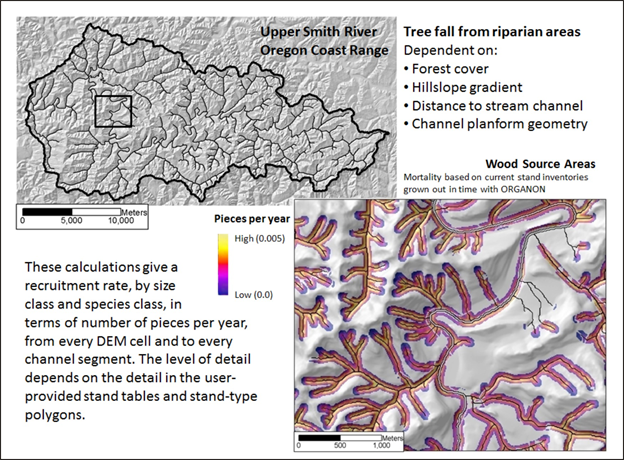
Model Description: The model calculates a single year recruitment potential from mortality (non stochastic tree death) for each stream reach in terms of number of pieces per 100 m, by average piece diameter classes. The model uses vegetation data on tree height and stand density using a range of diameter classes.
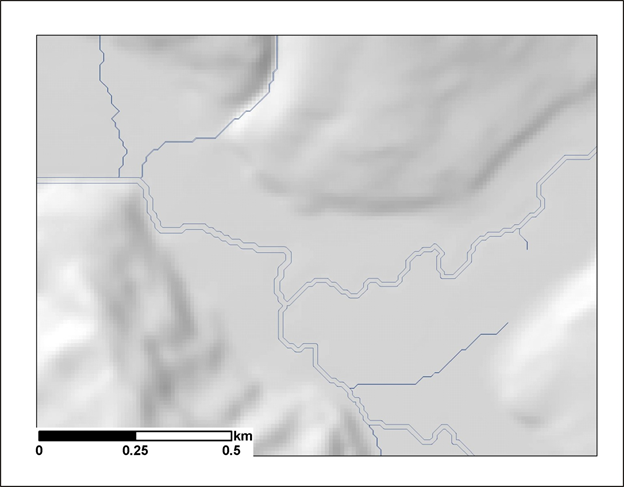
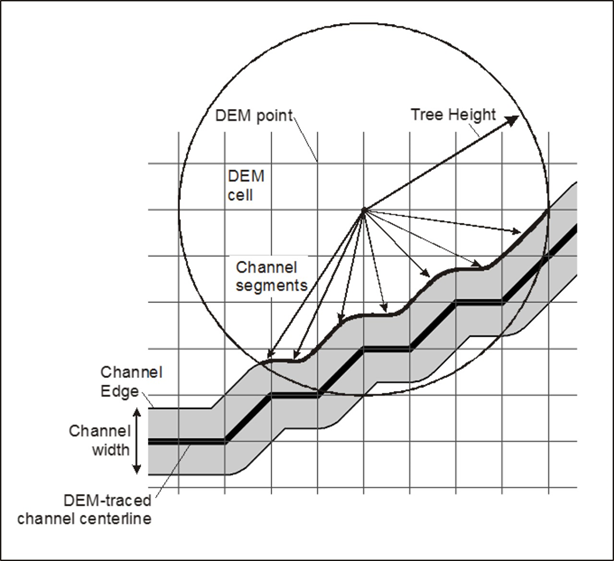
Figures 1 and 2. To estimate wood recruitment from riparian zones, we need to know where the edge of the channels are. Average channel width is estimated from regional regressions to drainage area and a buffer is applied to the channel centerlines to provide approximate channel-edge locations. Lake and reservoir shore lines can also be included. Each DEM point lies within a specific stand type. For each stand type, we have the number of trees, by size class (DBH, height) and species, and we have a mortality rate for each size-class + species combination. For each DEM point, for each size + species class, identify all the channel segments within a tree height of the point.
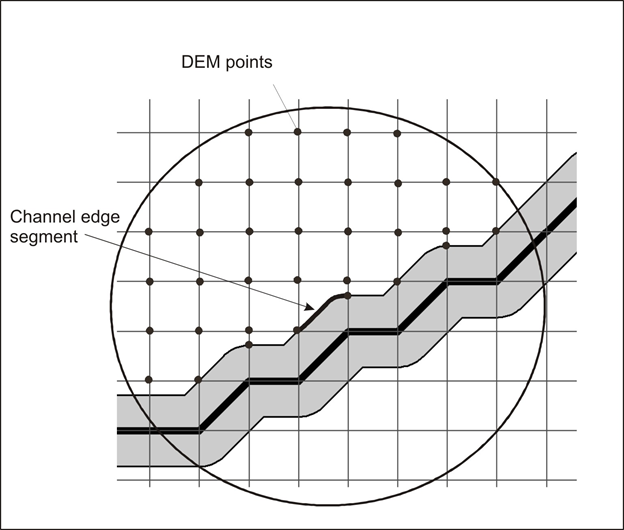
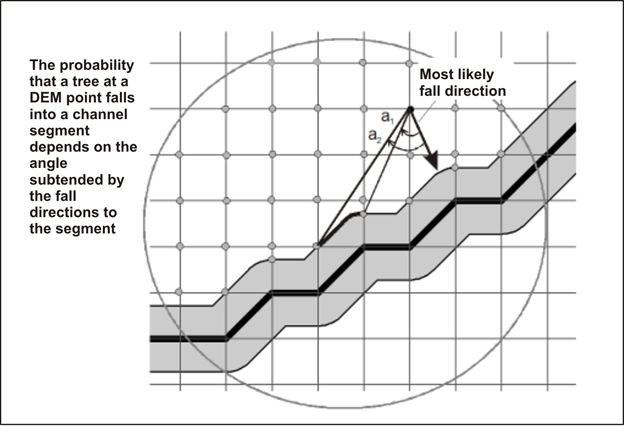
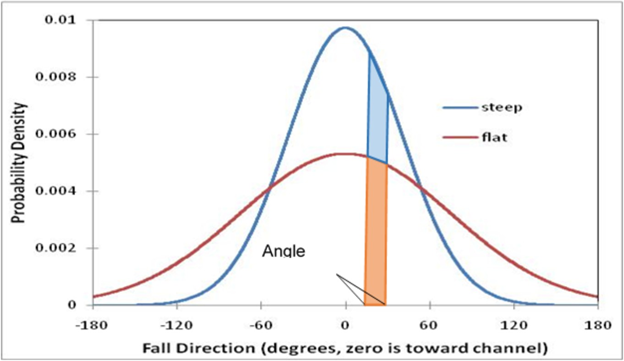
Figures 3 and 4. Then, for each stream segment, find every DEM point for which a tree standing at the point could potentially fall into the segment, based on tree height and channel-edge locations. The probability that a tree at a DEM point falls into a channel segment depends on the angle subtended by the fall directions to the segment. Every four DEM points define a DEM cell. Integrate the probability of the four corners over the cell to estimate the probability that a tree in the cell will fall into the segment. Sum over all cells containing trees that could fall into the segment. Repeat for all stream-edge segments.
Figures 5 and 6. The probability that a falling tree hits a channel depends on steepness of the channel-adjacent slope.
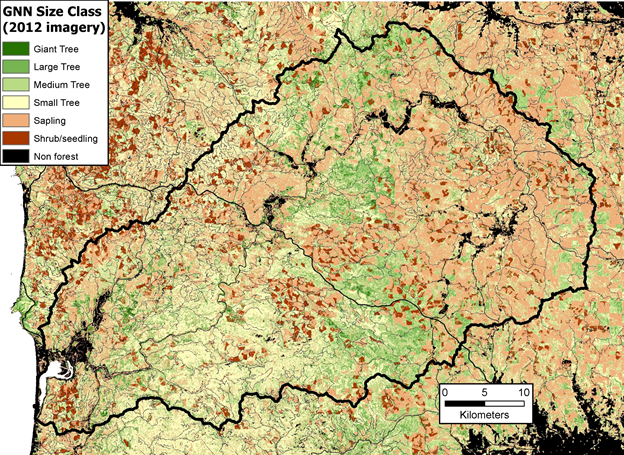
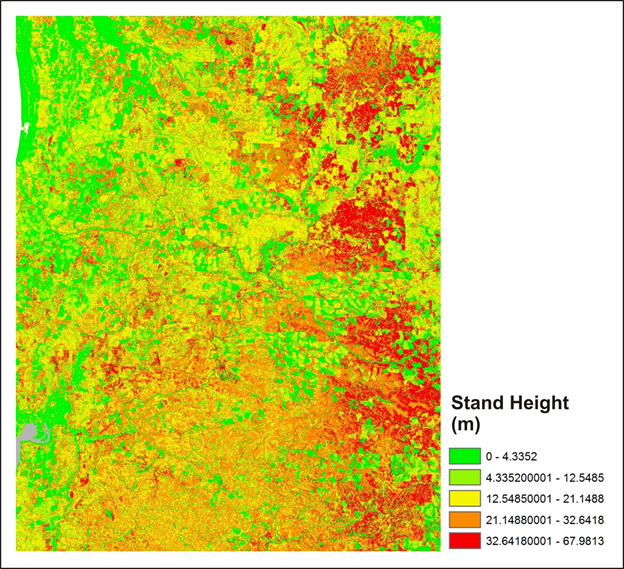
Figures 7 and 8. LEMMA data are used in Washington, Oregon and California.
Example Model Results Follow
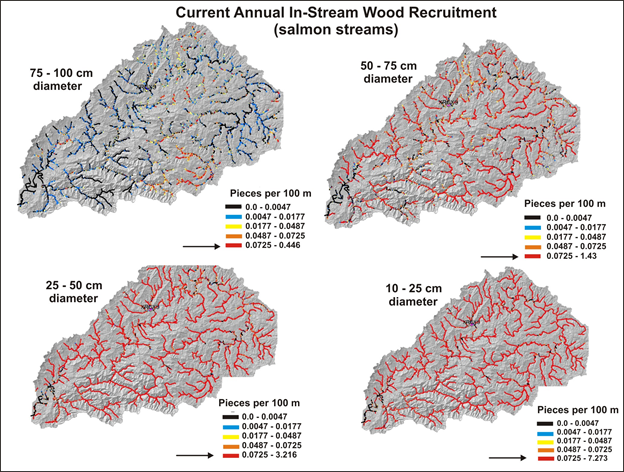
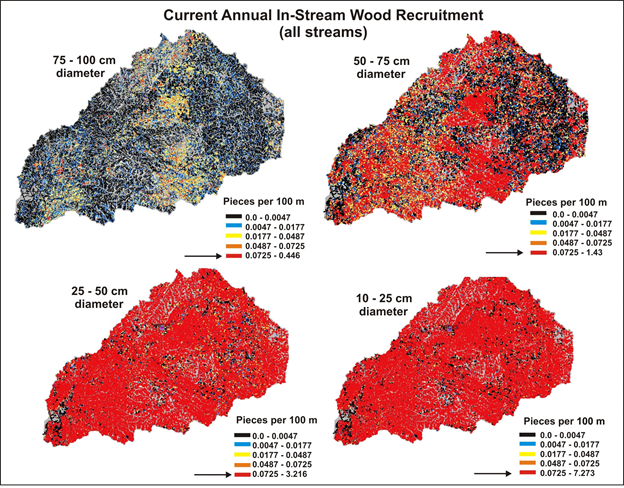
Figures 9 and 10. Left panel - results (in reach segments) for four in-stream wood diameter classes in the Nehalem watershed in northwestern coastal Oregon. Right panel - results shown only for salmon bearing streams. To learn more about the NetMap Watershed Restoration Analysis, go here.