TODO: To change the footer's content go to Dr.Explain menu Options : Project Settings : HTML (CHM) Export : Setup HTML Template and Layout
Shade/Thermal Energy
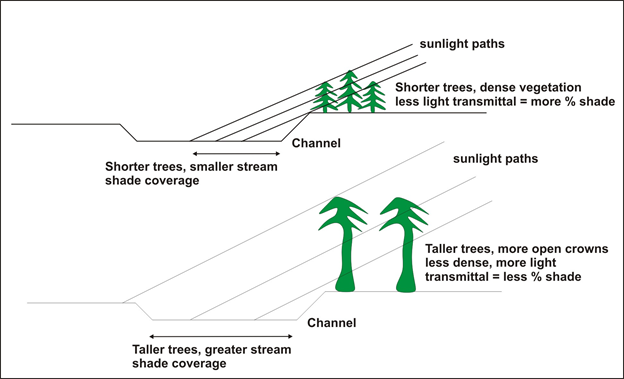
Figure 1. The shading and shadow relationships between shorter and more dense vegetation compared to taller and more open vegetation.
To run NetMap's Current shade-thermal loading tool requires remote sensing (GIS) data on basal area and shade. LEMMA data can be used in Washington, Oregon and California; in areas outside of that region or if users have their own spatial data they can use that in the model, but the data must be in the same format as LEMMA.
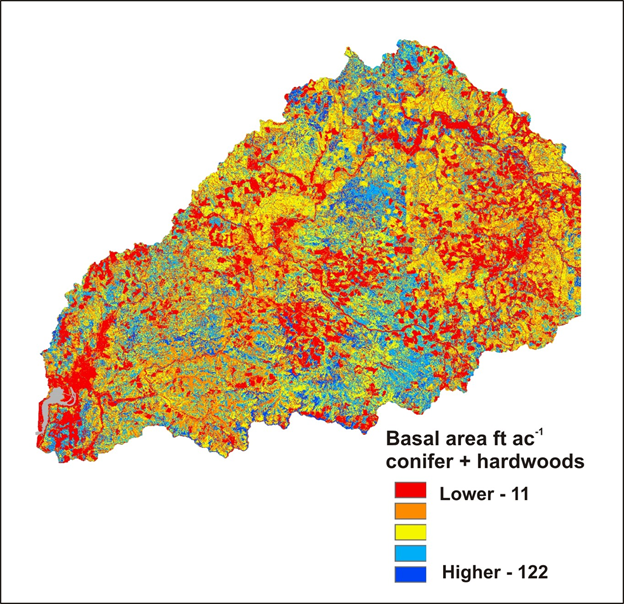
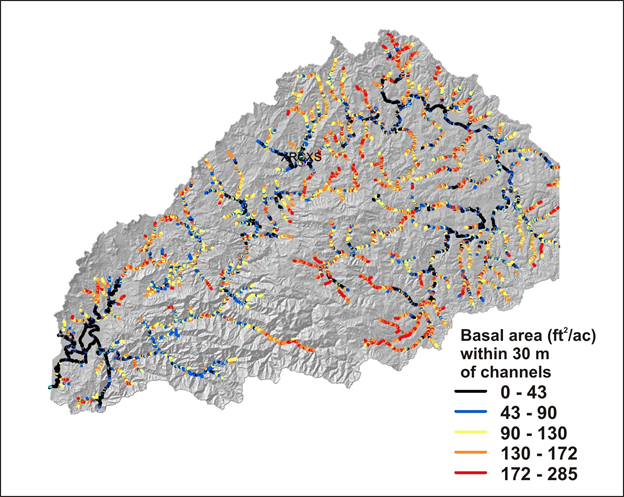
Figures 2 and 3. Spatial data (gridded, raster) on basal area in the Nehalem watershed (LEMMA) and basal area within 30 m of channels mapped to stream reaches (shown are salmon bearing streams only, from ODFW).
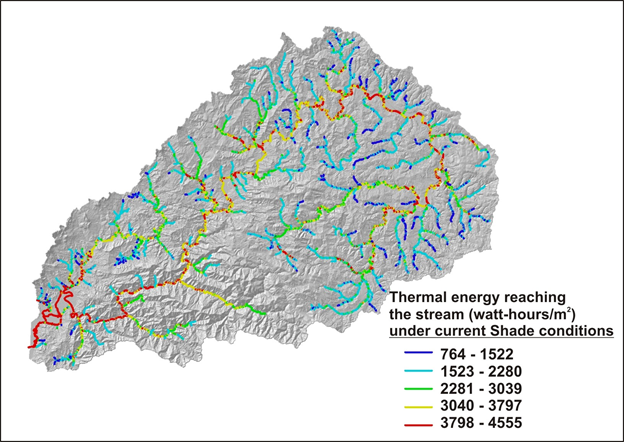
Using predictions for bare earth thermal energy to streams and the shade model, NetMap predicts the thermal energy load to streams and rivers based on current shade conditions (using basal area and tree height).
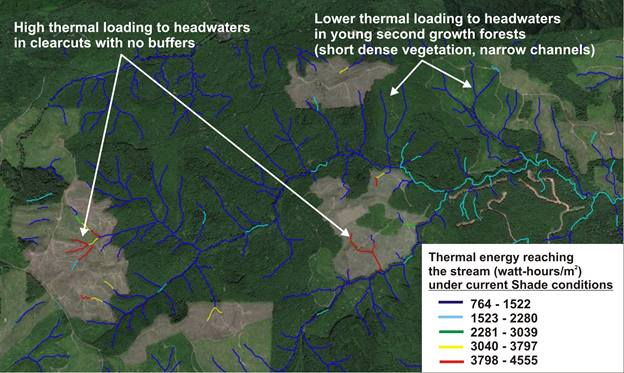
Figures 4. NetMap's predicted current thermal energy to streams and rivers under current shade conditions in the Nehalem watershed. The warmer colors indicate channel reaches with higher thermal loading conditions; only the salmon fish bearing potion of the network is shown. Figure 7 shows the predictions for headwater streams exported to Google Earth using a tool in NetMap (Google Earth Exporter).
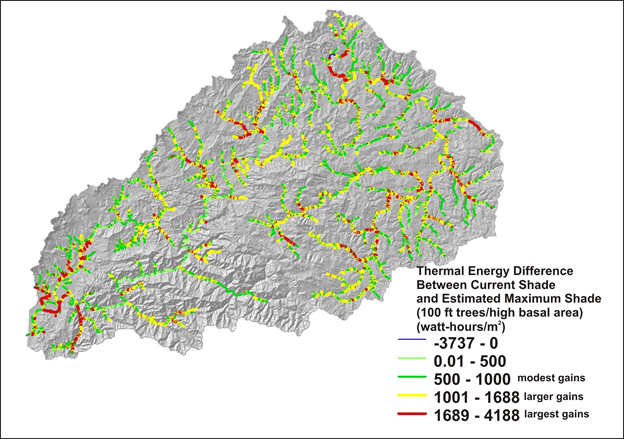
In a watershed many channels will not have their maximum shade potential because of current land use practices including forestry, agriculture and urbanization and the history of these and other factors such as wildfires. It could be important to know, in terms of restoring shade, which channels would benefit most from increasing riparian shade. Thus, NetMap's current shade-thermal energy tool includes a feature for a user to calculate the conditions of maximum shade (comination of tree height and basal area, although keeping in mind that shade is inversely related to tree height, see Figure 3). The tool will search, in any watershed, for the maximum shading condition (0-1, e.g., zero to 100%) and report the associated basal area and tree height values; however, a user can adjust the basal area and tree height values to either increase or decrease the calculated shade values. Then the tool recalculates the thermal energy load to the stream using the maximum shade value (everywhere) and then calculates the difference between the maximum predicted shade-thermal energy and the current shade-thermal energy. The difference value provides information for where increasing shade will have the largest effect on channel thermal energy conditions.
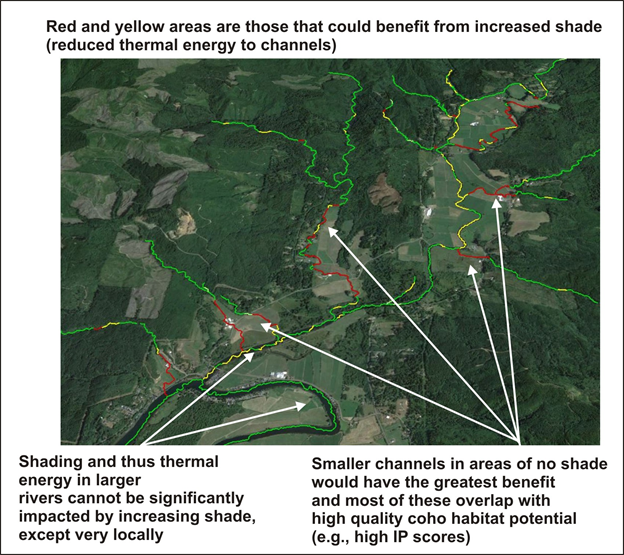
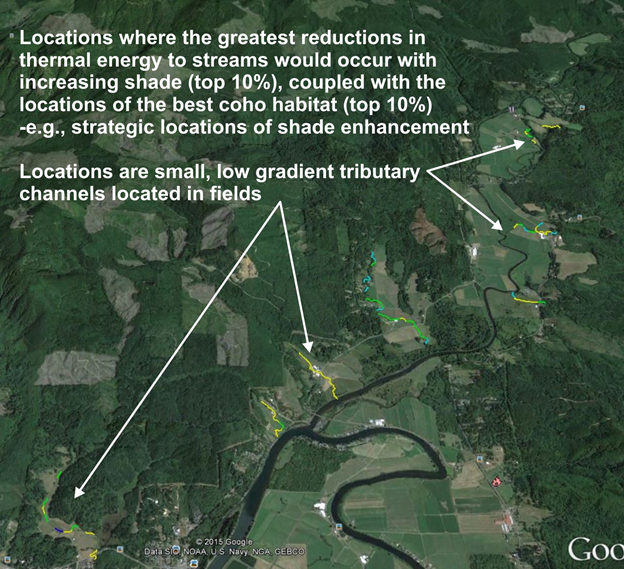
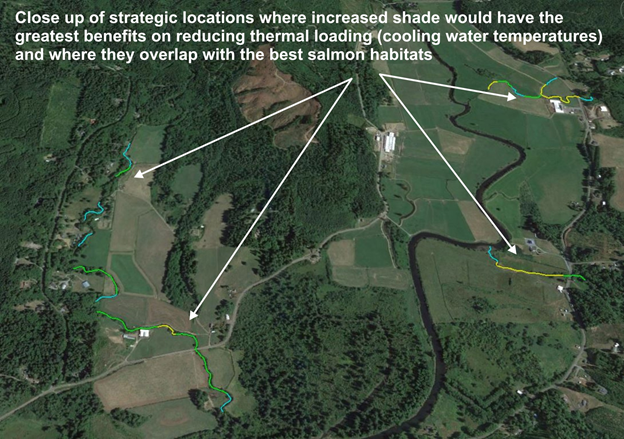
Figure 5. The predicted difference between a global, watershed wide shade factor of 0.87 (87%) corresponding to a maximum basal area of 122 and a tree height of 30 m. The warmer colors (yellows and red) indicate where increasing shade will have the largest effect at reducing thermal loading. Figure 9. Predictions exported to Google Earth show how the smaller channels (although high coho intrinsic potential fish habitat potential) within agricultural areas (with little stream side vegetation) would gaim the most from increasing shade conditions, where as the larger rivers would have have very large effects, considering the larger channel widths.
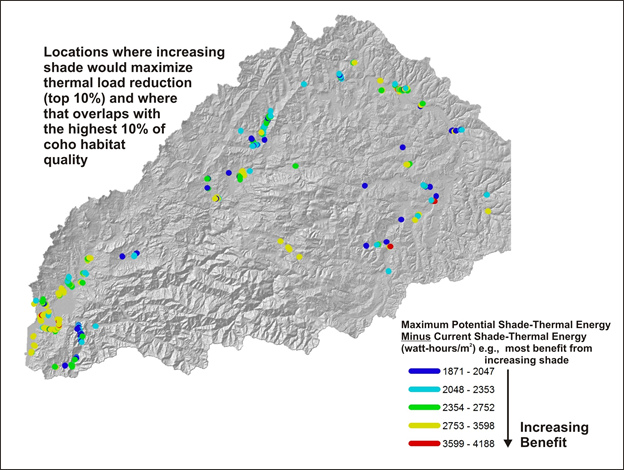
Example Application of Locating the Most Strategic Locations for Increasing Shade