Model Description:
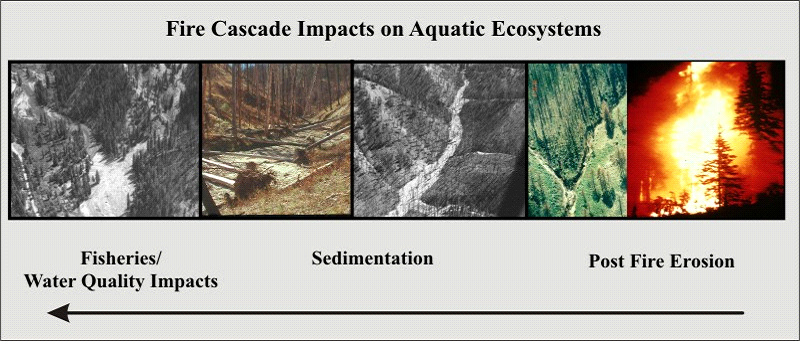
Wildfires can represent a significant environmental stressor. High fire severity (large flame length) can lead to extensive areas of mineral soil, accelerated erosion (surface, gully, landsliding), increases in channel sedimentation and large impacts on water quality and fish habitats. This is referred to as the “Wildfire Cascade” in NetMap (Figure 1). However, under certain conditions, wildfires and associated accelerated delivery of sediment and organic material to streams can provide long term net ecological benefits (Benda et al. 2003)
Figure 1. A “fire cascade” is the cascading sequence of impacts that begins with high severity fire, accelerated erosion, increased channel sedimentation and large impacts on fisheries and water quality.
Example Application:
Wildfire Analysis
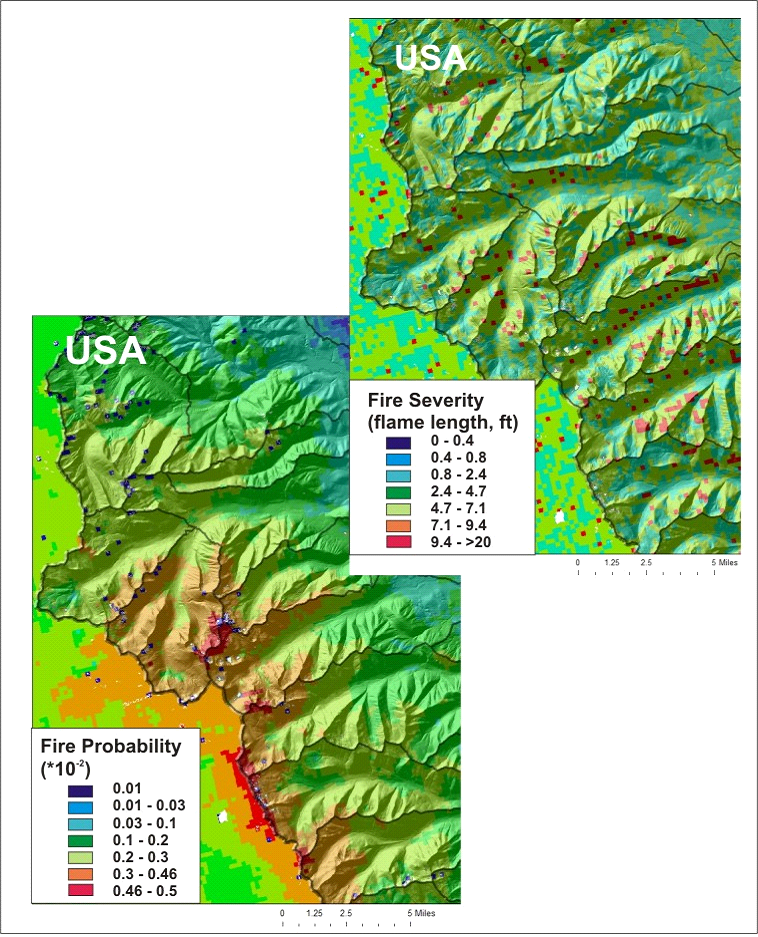
Fire probability and fire severity (flame length) were accessed from federal wildfire predictions (WWETAC). The post fire erosion prediction (surface erosion using the WEPP model) used results from Miller et al. (2011). Wildfire probability and severity forecasts were available for only the US portion of the Flathead River watershed. Figure 5 shows the spatial data (grid) on forecasted wildfire probability (1/p = fire recurrence intervals) and the predicted fire severity (flame length in feet).
Figure 1. The predicted fire probability (lower) and fire severity in terms of flame length (upper) are mapped across the US portion of the Flathead River watershed. See Figure 2 for a fish eye view of fire severity.
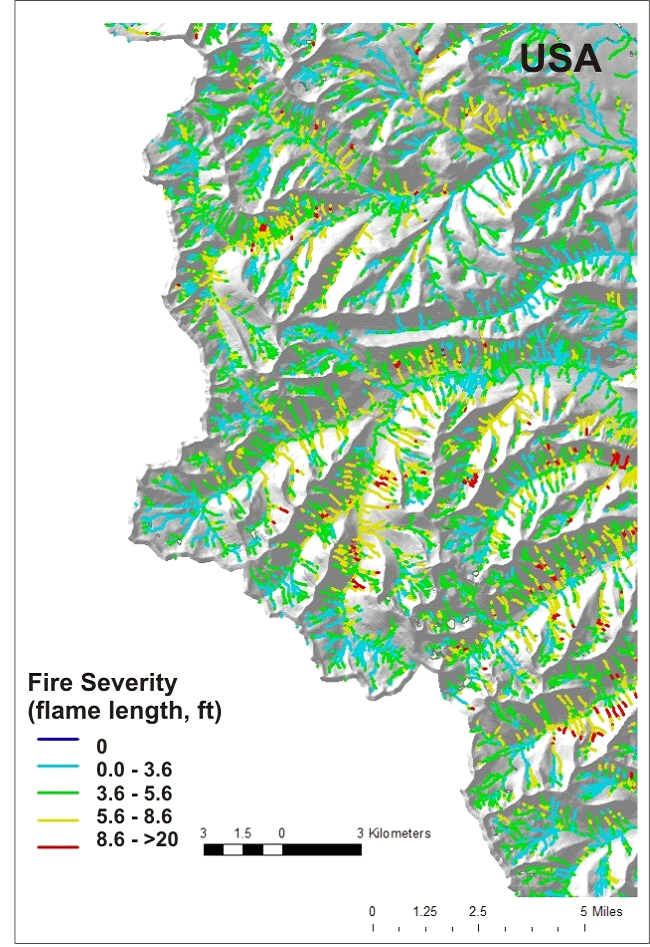
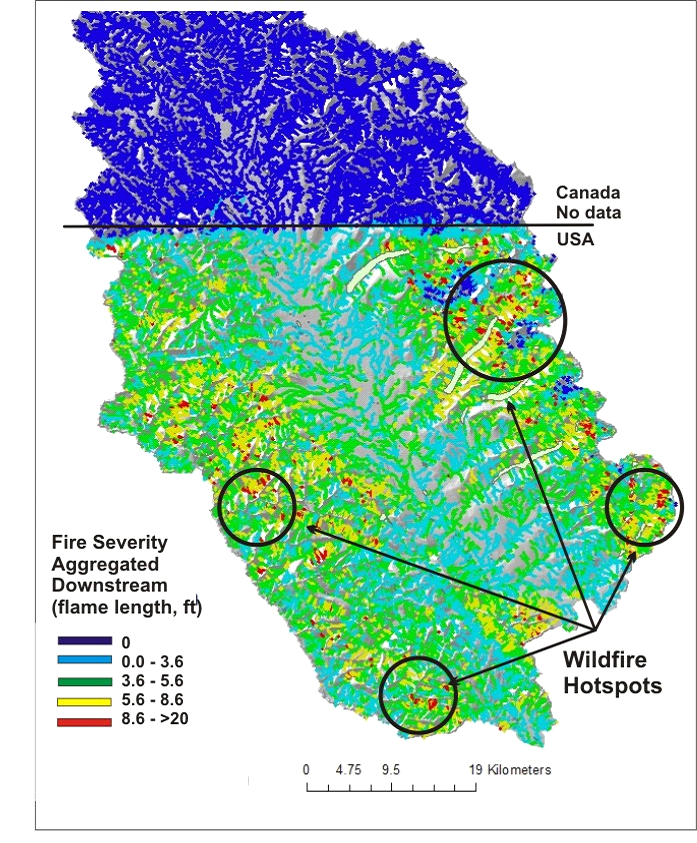
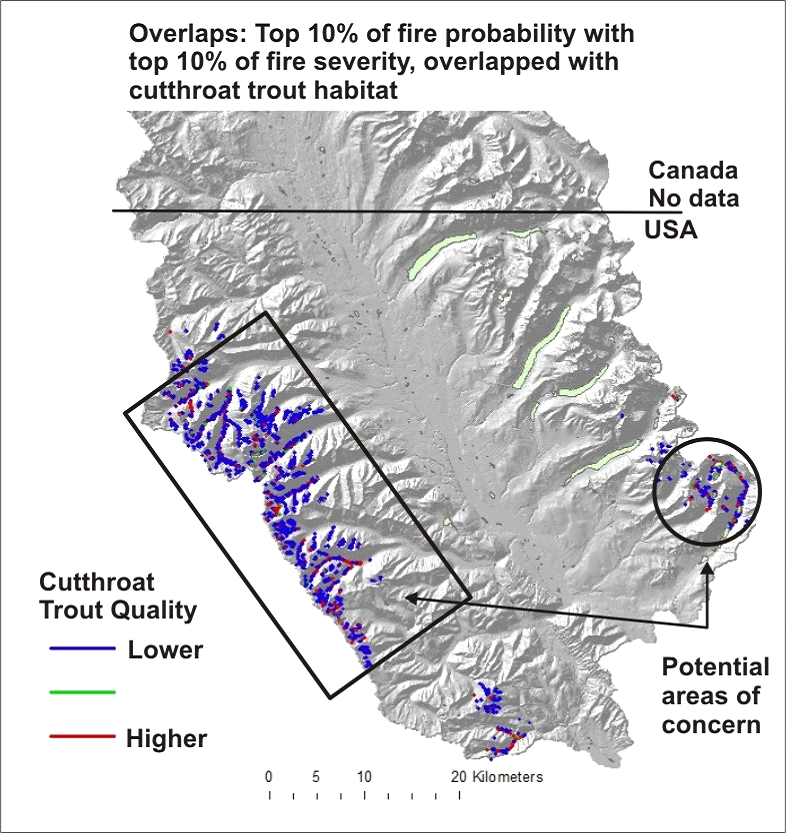
Using the channel segment scale drainage wings in NetMap, predicted fire severity is reported to stream segments, offering a channel- or fish-eye view of fire severity (Figure 6). In addition, the channel segment values are aggregated (summed and area weighted) downstream in NetMap, providing a means to examine predicted fire severity at any spatial scale defined by the channel network (Figure 7). NetMap’s Fire Cascade tool is used to quickly identify locations in the Flathead River watershed where the highest fire probability overlaps with the highest fire severity, and where that pair of stressors intersect with cutthroat trout habitat (Figure 8).
Figure 2. Predicted fire severity in terms of flame length is mapped onto individual channel segments using NetMap’s reach scale local contributing area, providing a fish eye view of fire severity.
Figure 3. Predicted fire severity (flame length) is aggregated downstream revealing tributary scale patterns of fire severity across the US portion of the watershed. The smaller tributaries with the highest fire severity are shown in red indicating general geographic areas with higher fire severity potential.
Figure 4. NetMap’s Fire Cascade Tool is used to identify intersections among various watershed attributes. Illustrated here is the intersections between the highest 10% of fire probability and the highest 10% of fire severity. These areas as represented at the channel segment scale (4% of all segments) are mapped (color coded) according to the predicted westslope cutthroat habitat intrinsic potential score (habitat quality). Certain areas of the Flathead River watershed are highlighted (no data in the Canadian portion). This information, among other NetMap analyses, could be used in pre wildfire planning activities (e.g., fuels reduction, prescribed fire etc.).
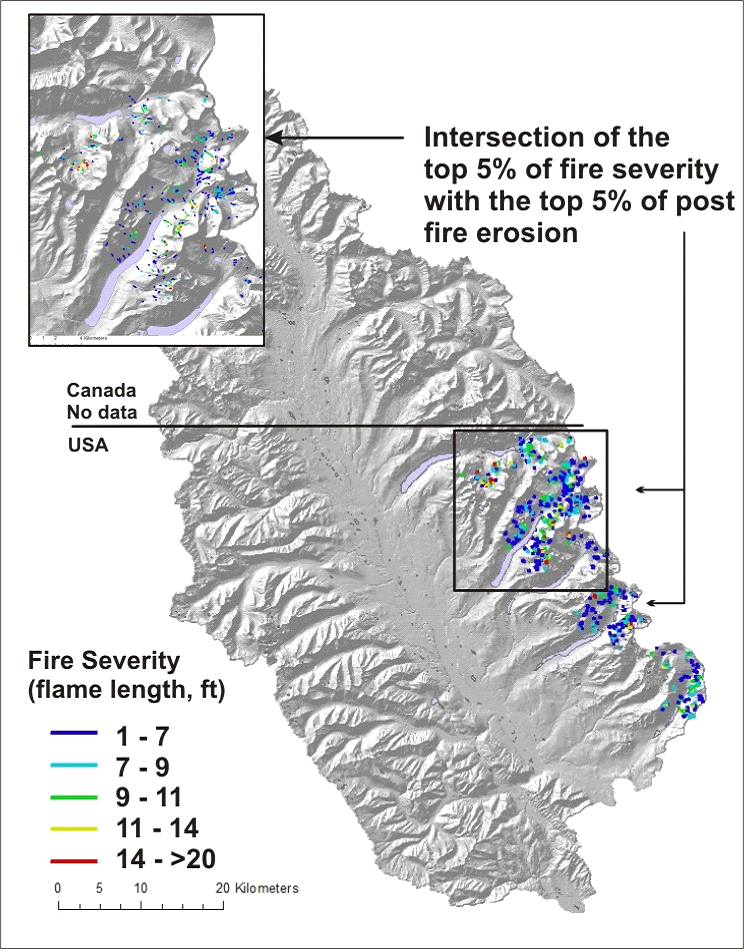
An analysis of the highest predicted fire severity and the highest predicted post fire erosion (using results from Miller et al. 2011) reveal where the intersections exist between these two stressors (Figure 9).The area of the greatest risk is located in the southeastern portion of the higher elevation areas of the Flathead watershed. Such information could be used to help guide wildfire mitigation efforts, including fuels reduction.
Figure 4. NetMap’s Fire Cascade Tool is used to identify intersections between the highest 5% of fire severity and the highest 5% of post fire erosion potential (surface erosion). This type of information could be used to inform pre wildfire planning strategies.
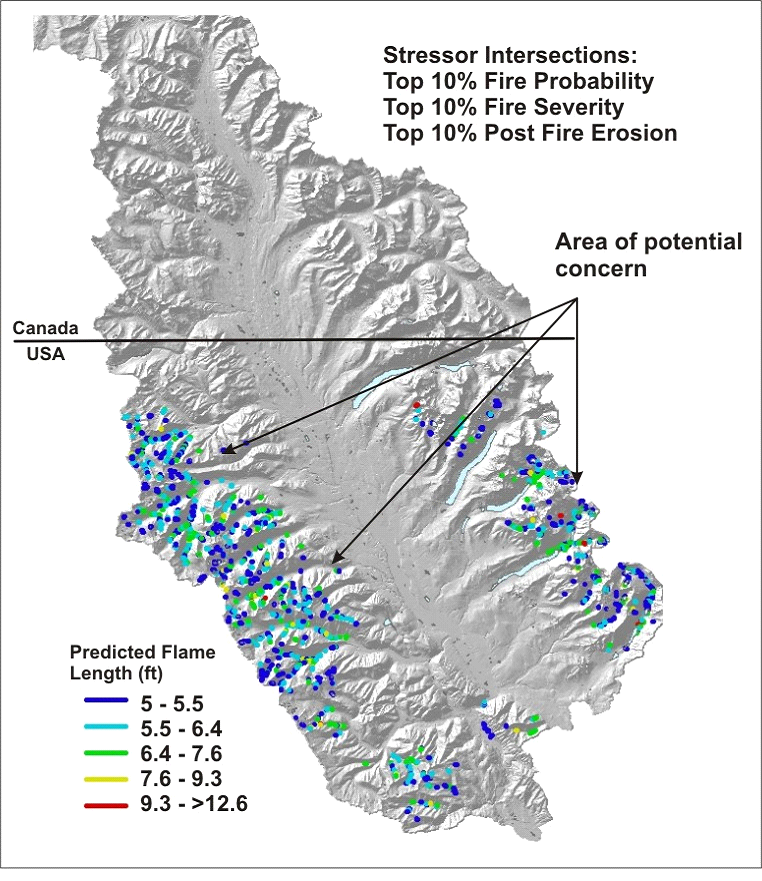
Such stressor analyses can include fire probability, fire severity and post fire erosion, providing additional data to inform pre wildfire planning.
Figure 6. Locations (as reported in channels but representing adjacent hillside, via drainage wings) in the Flathead River basin where the highest (top 10%) fire probability, fire severity and post fire erosion overlap.