Climate Change Vulnerability
Example:
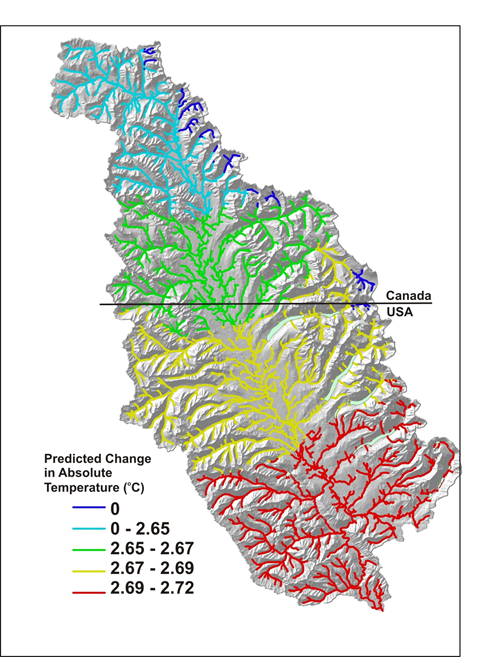
NetMap’s tool is used to search for landscape vulnerability to climate change by examining intersections among climate change, wildfire risk, and in-stream habitat and channel sensitivity indicators in the Flathead River basin in Montana (US Fish and Wildlife Service). Forecasts pertaining to mean annual temperature, precipitation, snow accumulation, and summer and winter flows are presented. Forecasts are available for both the US and Canadian portions of the Flathead River watershed. Additional background information is available from Littell et al. (2011).
Figure 1. Downscaled predictions for mean annual air temperature mapped as absolute increase (deg C) from year 2040 compared to historical (1916 – 2006). Although the raw data are in grid form, NetMap converts those values to channel segment values.
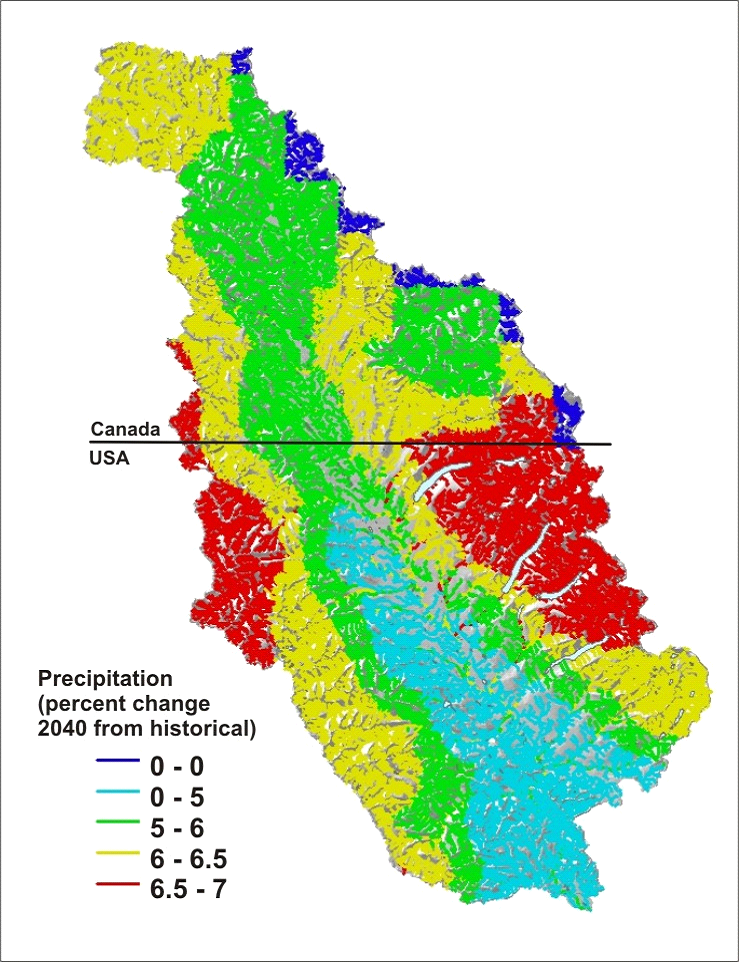
The downscaled climate change predictions also reveals that average annual precipitation may increase (rain and snow combined), although non-uniformly across the watershed. However, GCM predictions do not consider orographic effects of westerly winds and these are decreasing, leading to declines in mountain precipitation and thus to potentially lower flows (Luce et al. 2013).
Figure 2. UW Climate Impact Group GCM projections (downscaled) reveal a spatially variable increase in annual precipitation across the Flathead River watershed.
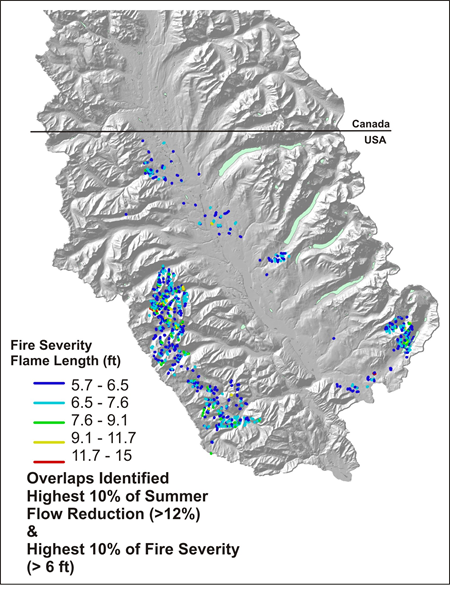
Wildfire is an important environmental stressor in the Flathead River watershed and the incidence of fire may increase in a warming climate. NetMap’s climate change vulnerability tool is used to search for locations where the highest 10% of projected reductions in summer flow overlap the highest 10% of present day fire severity.
Figure 3. NetMap’s climate change vulnerability tool is used to identify locations in the Flathead River watershed where the highest 10% of climate change induced reductions in summer flow overlap the present day highest 10% of fire severity (flame length). Such potentially sensitive areas are concentrated in the southwestern portion of the basin on the US side of the border (no fire risk data in Canada was used in this analysis).
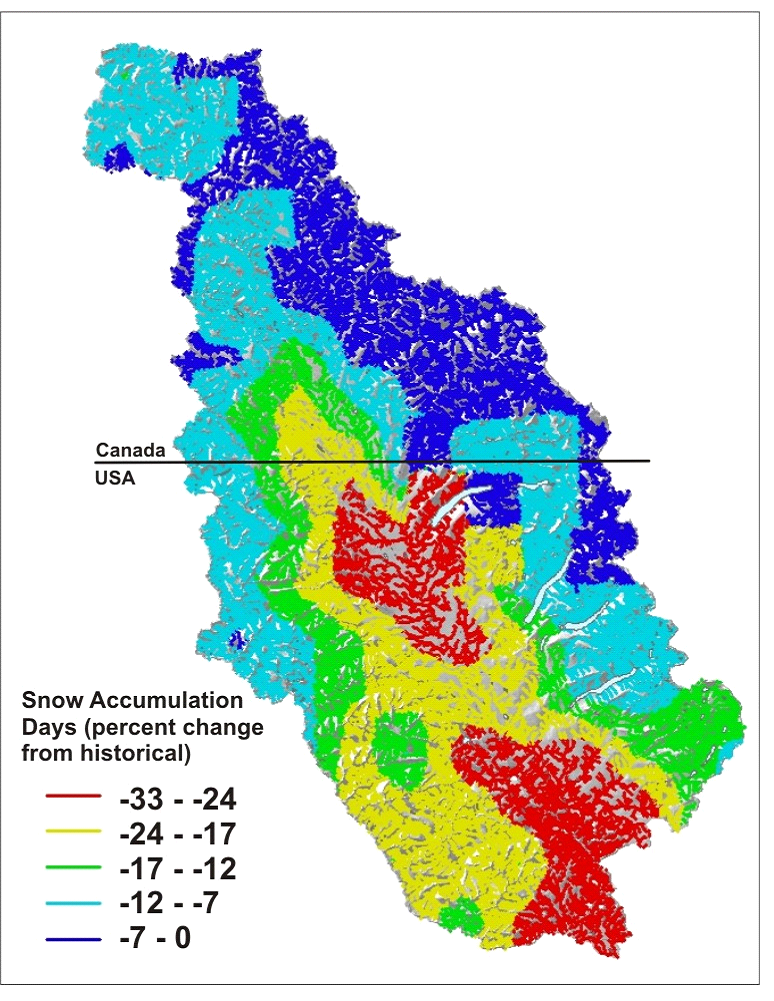
Downscaled climate change projections also reveal significant reductions in snow accumulation days across the watershed, with the highest predicted reductions in the US side of the border. The forecasts defines elevation bands surrounding the N-S Flathead River mainstem with reductions that increase from higher to lower elevations ranging from less than a few percent to a maximum of greater than 30% along the mainstem in the US portion of the basin.
Figure 4. UW Climate Impacts Group climate change forecasts for reductions in snow accumulation days in the Flathead River watershed.
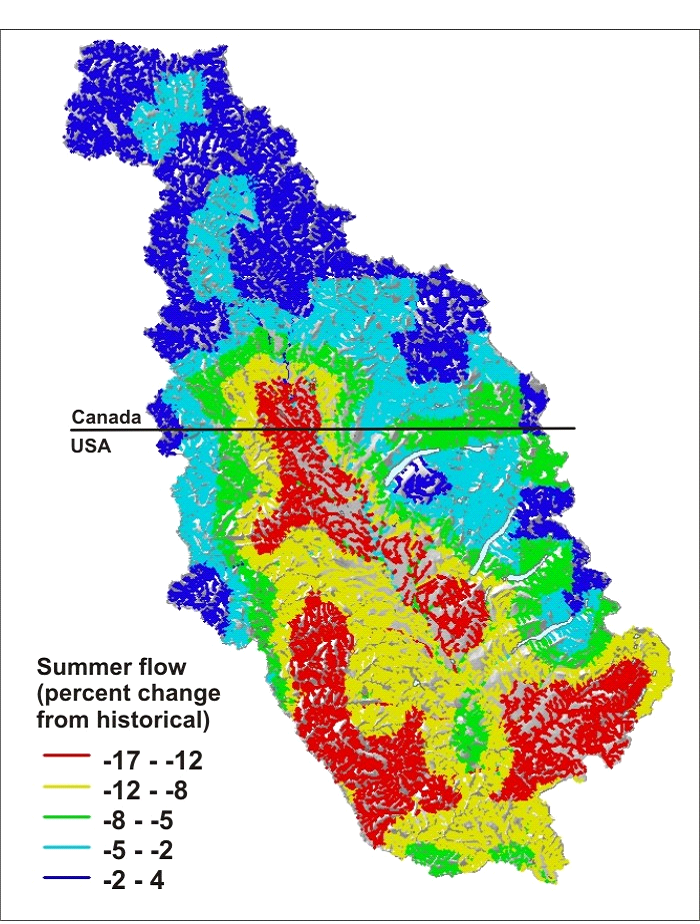
Total precipitation is forecasted to increase across the Flathead River watershed due to climate change (although modestly to a maximum of 7% by 2040). However, the significant change in winter precipitation as snow leads to forecasted reductions in summer runoff of up to 12 to 17%. But see the recent work of Luce et al. (2013) on decreased orographic effects leading to reduced flows in the northwestern US.
Figure 5. UW Climate Impacts Group predictions of reductions in summer flow show the largest impacts occurring in the US side of the border and along the lower western and eastern basin boundaries.
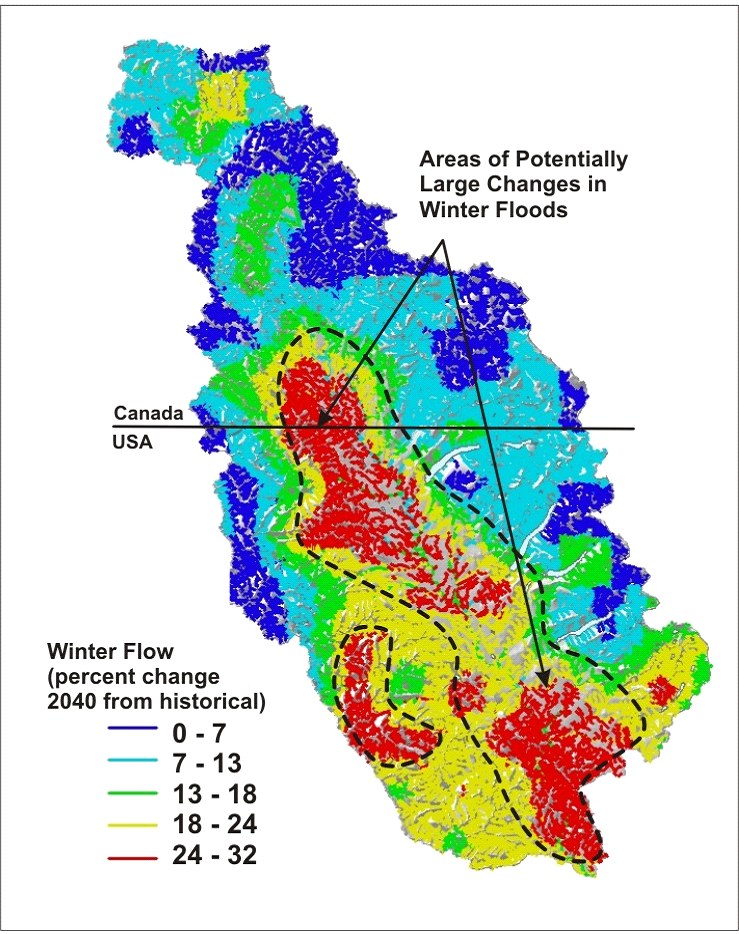
The predicted conversion of winter snow to winter rain due to a warming climate (Figure 38) in the Flathead River watershed can result in increases in winter flows. This could yield an increase in rain dominated floods or rain-on-snow floods with the greatest potential impacts along the mainstem river and adjacent lowland tributaries.
Figure 6. UW Climate Impacts Group forecasts for increases in winter flow. The largest changes are forecast for the mainstem and adjacent lowland tributaries on the US side of the border.