TODO: To change the footer's content go to Dr.Explain menu Options : Project Settings : HTML (CHM) Export : Setup HTML Template and Layout
Instream Thermal Sensitivity
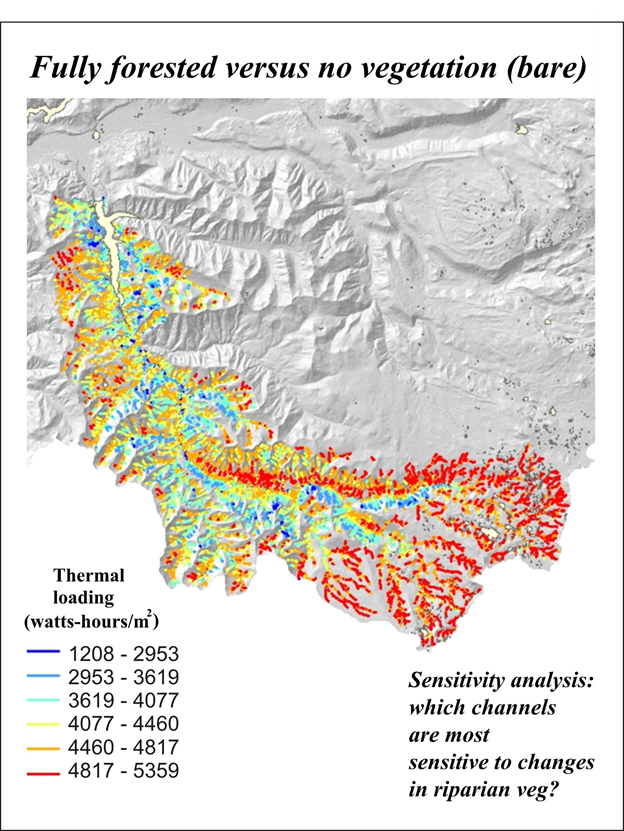
Figure 1. NetMap's thermal tool is used to calculate a sensitivity analysis - which channels, if riparian vegetation was removed or decreased, would be the most sensitive. In watt-hours/m2.
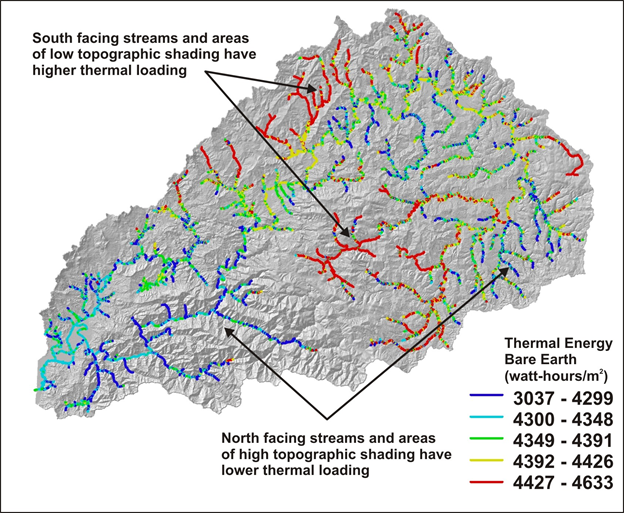
Figure 2. Using NetMap's Thermal Load Sensitivity Tool, this figure shows a prediction of bare earth solar radiation into streams in the Nehalem watershed in northwestern coastal Oregon. Bare Earth thermal energy is then reduced by current shade estimates (see below).
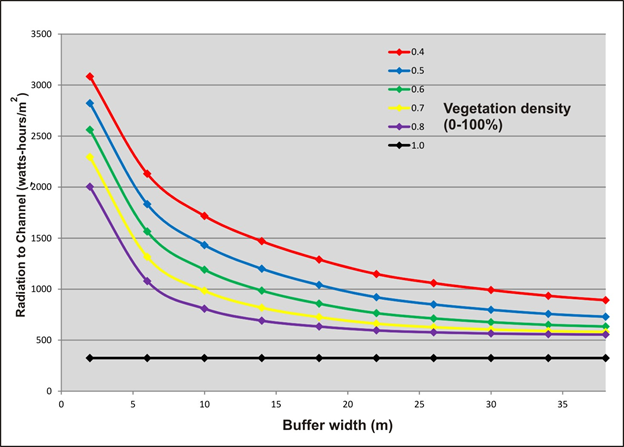
Figure 3. NetMap's thermal tool is sensitive to varying vegetation density. The width of the buffer required to meet a specific thermal loading target increases with decreasing vegetation density. See also Figures 5 through 7. In watt-hours/m2.