TODO: To change the footer's content go to Dr.Explain menu Options : Project Settings : HTML (CHM) Export : Setup HTML Template and Layout
Gully Potential
Model Description:
NetMap’s gully model employs the Compound Topographic Index (CTI) as a predictor of ephemeral gully potential (Parker et al. 2010). CTI is calculated for each grid cell in NetMap's Digital Hydroscape. CTI is defined as:
CTI = A * S * PLANC
where A is the upstream drainage area (L2), e.g., the number of pixels draining to any point on the landscape, S is the local slope (L/L), which combined is a proxy for runoff discharge, and PLANC is the planform curvature (1/L), a measure of hillslope curvature (negative for ridges and positive for swales) (Zevenbergen and Thorne 1987).
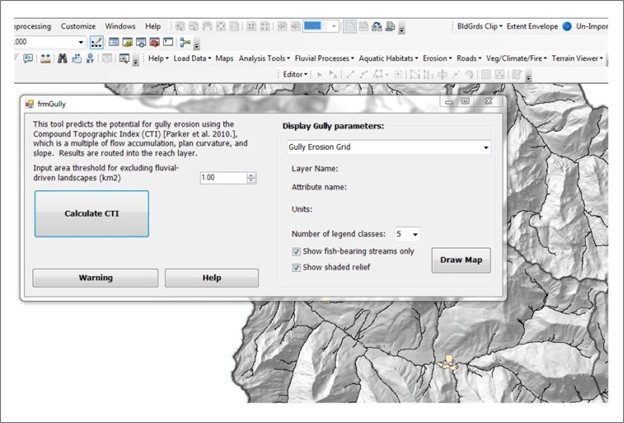
A user first provides an area threshold to limit the gully erosion prediction into the fluvial network (1 km2 is the default). Running the two creates three outputs: 1) hillslope prediction (grid), which can include channel cells, 2) gully potential reported to reaches and 3) gully in reaches (gully values summed via drainage wings), summed (aggregated) downstream.
Figure 1. The gully tool interface. A user inputs an area threshold and then proceeds to calculate gully erosion potential.
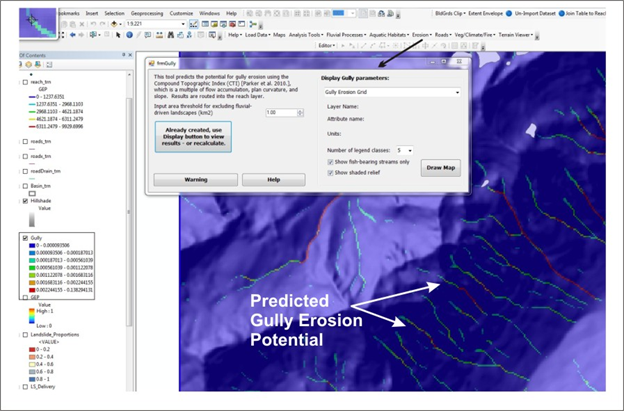
Figure 2. An example of the gully erosion potential grid.
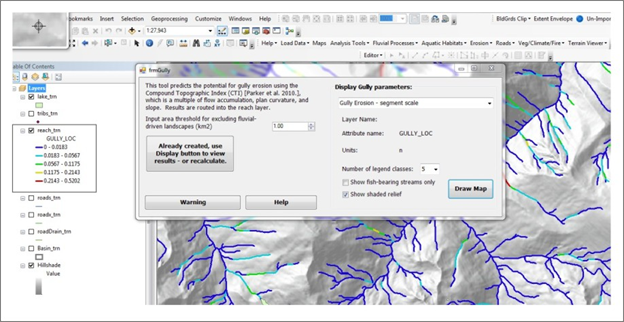
Figure 3. An example of the gully erosion potential in reaches. The reach scale prediction of gully erosion represents the drainage wing sum of gully erosion potential. Segment scale values are summed downstream providing a running sum (downstream) of total gully erosion potential, useful for considering tributary scale variation in hillslope gully erosion potential. These parameters could be considered in the context of fire probability and fire severity.