Surface Erosion Potential
Model Description:
The Water Erosion Prediction Project (WEPP) is a physically based erosion model developed by a group of US Federal Agency scientists: the Agricultural Research Service, US Forest Service, Natural Resources Conservation Service, Bureau of Land Management, and the US Geological Survey. WEPP contains modules that account for the processes of surface hydrology, winter hydrology, water balance and percolation, soils, plant growth, plant residues, and hillslope surface erosion. Cligen is used to simulate weather to run the erosion calculations. WEPP (Disturbed) was integrated within NetMap’s Digital Hydroscape where hillsides are divided into “drainage wings”, local contributing drainage areas on either side of channel segments (Figure 1). Each drainage wing in NetMap is divided into three Overland Flow Elements (OFE); the OFEs are used to calculate surface erosion using WEPP, thus providing a spatially explicit analysis of the responses of multiple hillslopes to unburned land cover type, to postfire burn severities, and to pre-fire projections of burn probabilities and severities. WEPP is run in continuous simulation mode for 100 or more years.
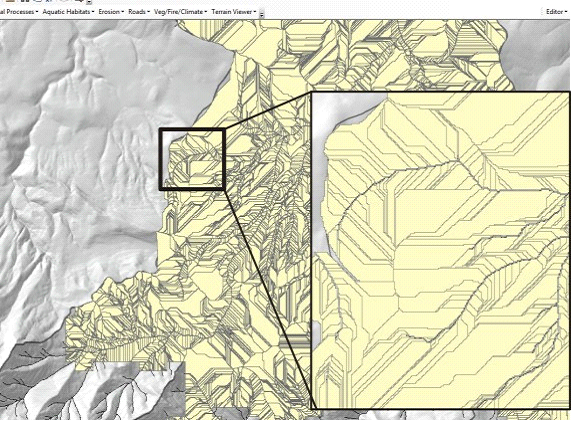
Figure 1. “Drainage Wings” in NetMap are used in the application of WEPP (Disturbed) for standard vegetated conditions, post wildfire and pre wildfire estimates of surface erosion.
15
Analysis Options and Management Applications
WEPP can be used to simulate erosion using four scenarios:
1) Non Fire: Predict surface erosion potential for unburned conditions using mapped vegetation classes; use default land cover layer (or provide your own but with the correct format).
Application: This option is used to consider land use impacts on erosion potential (such as logging or grazing etc.).
2) Pre Fire (severity only): Predict surface erosion potential based on the most probable fire severity as predicted by WWETAC FireSim; FireSim predicted flame lengths (fire intensity) are grouped into three severity classes of High, Moderate and Low (see Table below); Data from Western Wildland Environmental Threat Assessment Center (WWETAC) flame-length layers; available for the contiguous US only, i.e. not Alaska or Hawaii.
Application: Use this option for pre wildfire planning purposes to determine where, in a watershed, reductions in fuels and fire severity would have the largest beneficial effect in reducing erosion and impacts to water quality and fisheries. For analyses at larger scales (entire watersheds) see the “Fire Cascade” tool in NetMap (under the tab “Vegetation/Fire/Climate”). For regional or forest wide analyses of fire severity and erosion, go to the TerrainViewer (also located on the NetMap Add-in).
3) Pre Fire (burn probability combined with severity): Predict long term erosion regimes (frequency - magnitude distributions) that include both unburned and burned conditions (natural climate) over periods of a couple of hundred years (e.g., long term stochastic sediment budget) that utilize Western Wildland Environmental Threat Assessment Center (WWETAC) burn probability and flame-length layers and land cover for unburned periods; available for the contiguous US only, i.e. not Alaska or Hawaii.
Application: Use this option to consider the natural erosion regime that includes fires and to determine which areas of your watershed have highest potential for extreme erosion events.
4) Post Fire: Predict post-fire erosion (severity) with a user-provided land cover layer that includes actual fire severity values (e.g., as contained within a Burned Area Reflectance Classification [BARC] map).
Application: Use this option for post wildfire restoration such as during a Burned Area Emergency Response (BAER) effort.
Example Applications
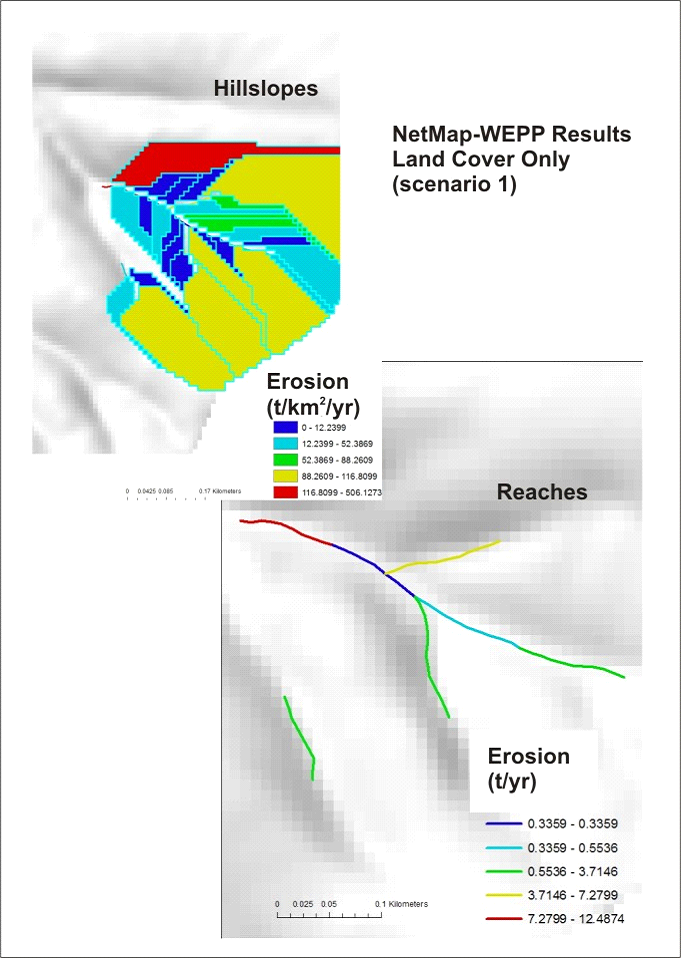
Figure 2. Results from using land cover only (application scenario 1).
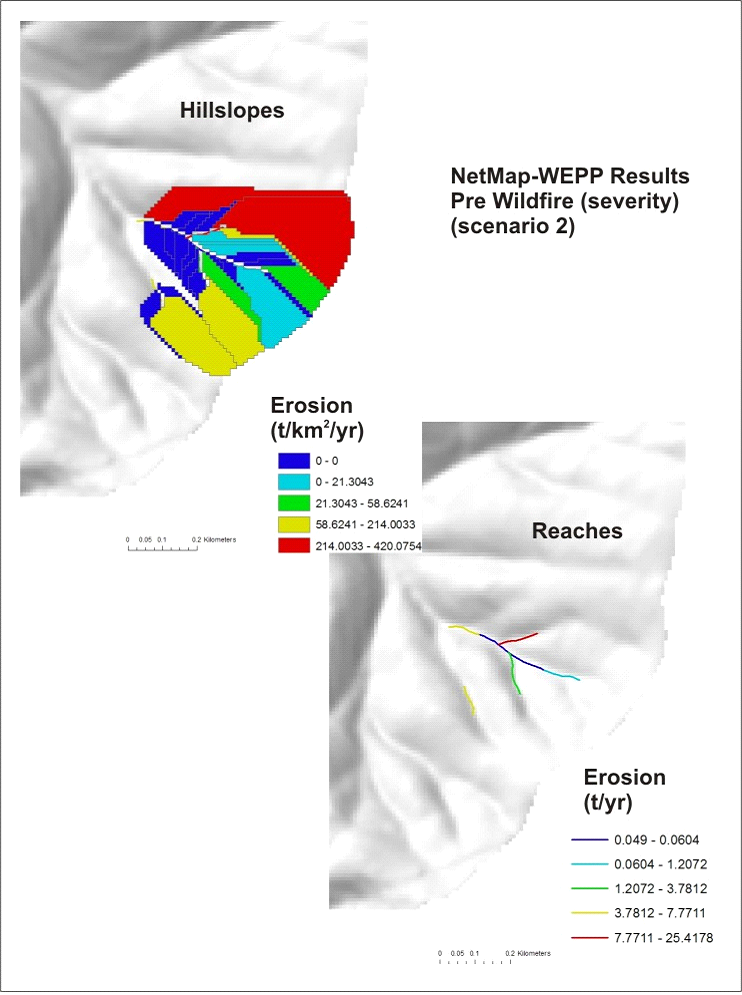
Figure 3. Results from WWETAC probable fire severity (e.g., predicted flame length in categories of High, Moderate and Low) (application scenario 2).
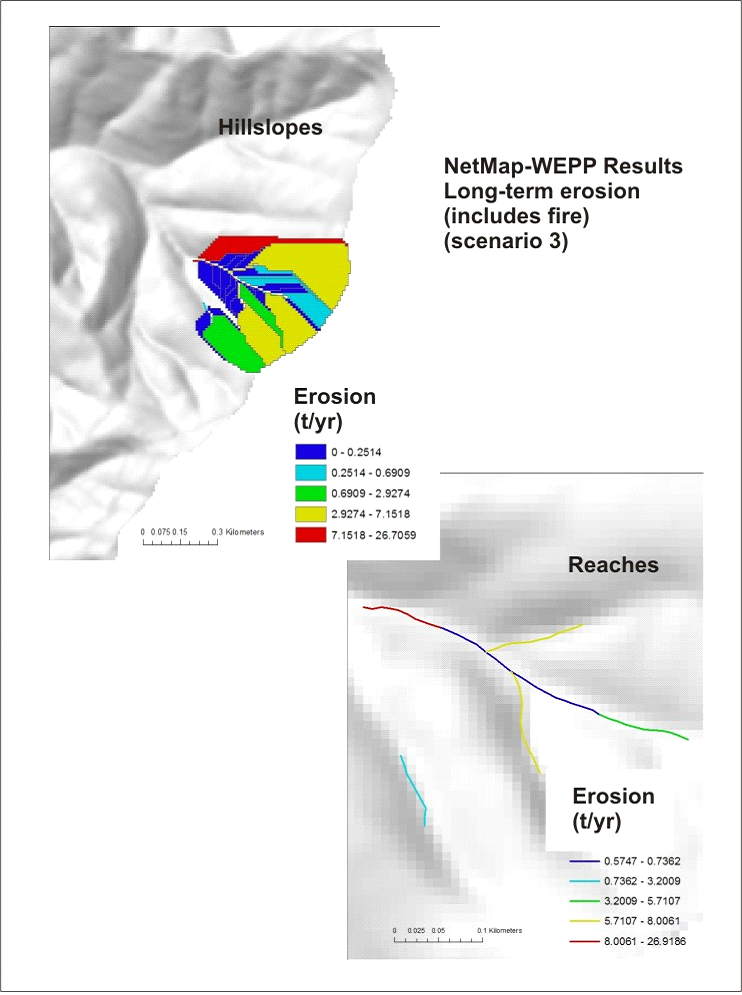
Figure 4. Results from WWETAC probable fire severity combined with fire probability and including non-fire periods to predict long term stochastic distribution of sediment yields (application scenario 3).
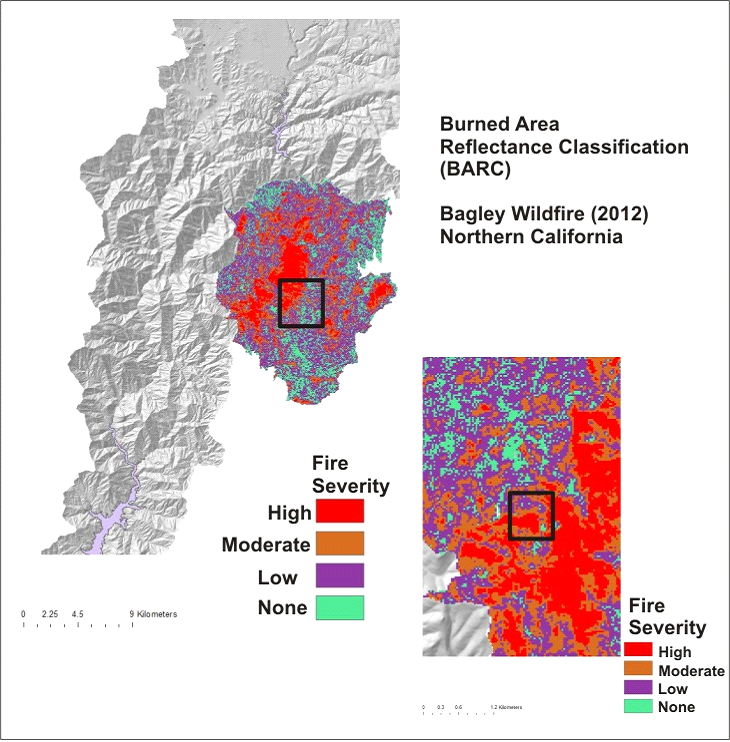
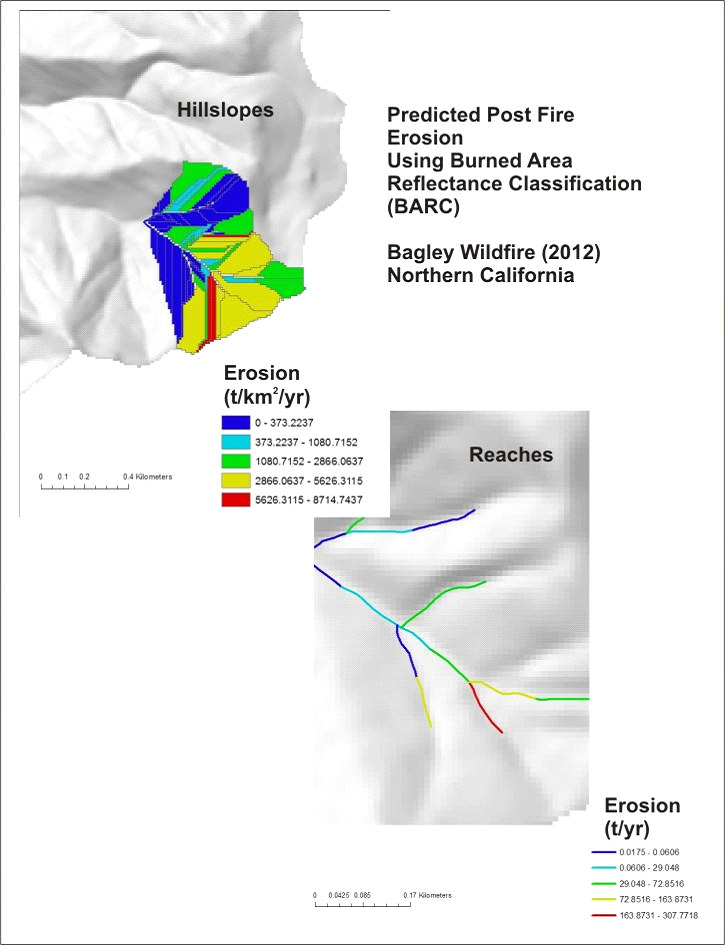
Figure 5. A burned area reflectance classification (BARC) map from the 2012 Bagley Fire in Northern California, used in the NetMap-WEPP tool (scenario 4).
Figure 6. Results from using the BARC map in the NetMap-WEPP tool.
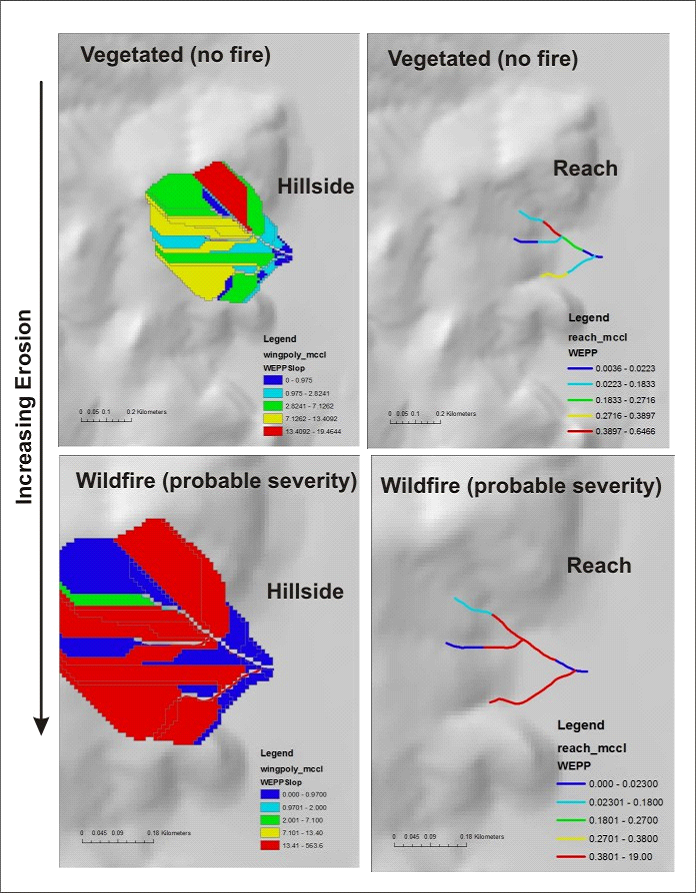
Figure 7. Results comparing vegetated conditions (no fire) erosion potential (upper panels) to wildfire conditions using the most probably fire severity (scenario 2). Note that large increases in erosion due to moderate and high severity fires.
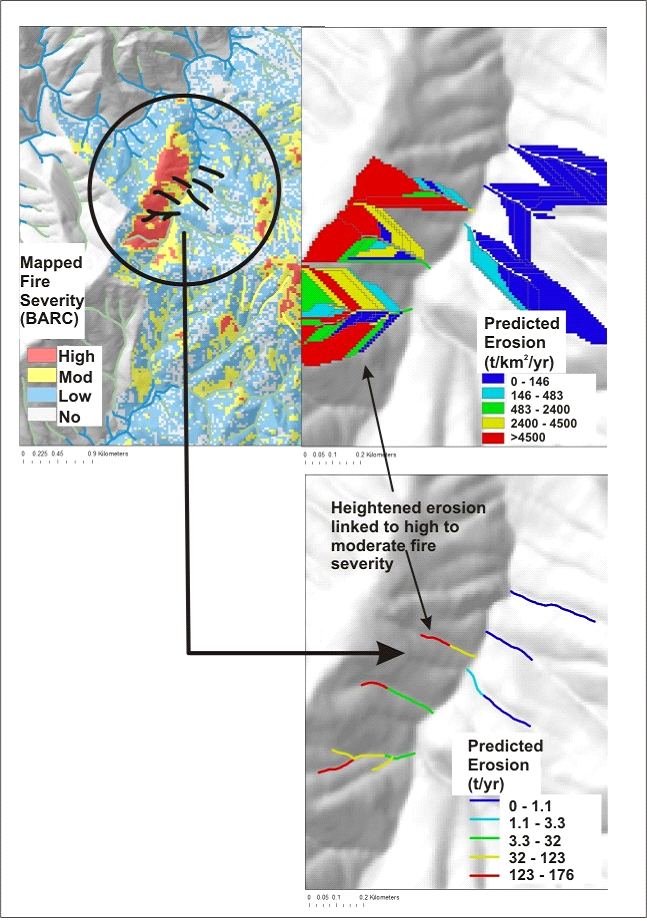
Figure 8. Results using a BARC map from the Bagley fire. The upper left panel shows the mapped fire severity (high, moderate and low). The upper right hand panel shows the predicted hillslope erosion. The lower right hand panel shows the predicted erosion in the stream channels. Note that the highest mapped fire severity (upper left hand panel) is associated with the highest predicted erosion potential (WEPP), on the hillslopes and in the channels. Area of low fire severity or no fires are predicted to have the lowest erosion potential.
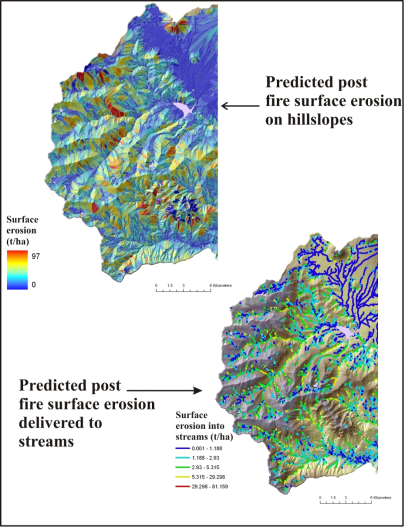
Figure 9. Output from the watershed-scale application of NetMap’s WEPP-based post fire surface erosion tool shows significant spatial variation in predicted hillslope erosion (top) and the delivery of that sediment to stream channels (bottom). The predicted flame length, based on current vegetation patterns in the Upper Sacramento watershed in northern California, was derived from Flammap, a federal agency fire hazard prediction model (http://www.firemodels.org/content/view/14/28/).
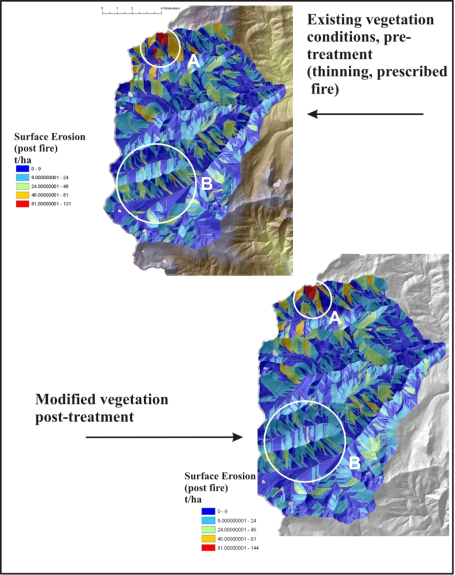
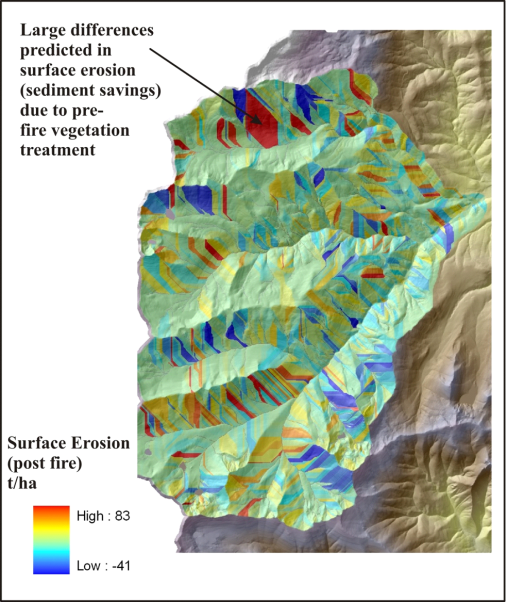
Figure 10. Comparisons between pre- and post vegetation treatment shows where surface erosion (following wildfire) is predicted to change.
An erosion ‘difference map’ can be produced, reflecting how pre-fire vegetation treatment may affect future, post-fire erosion events. This type of sensitivity analysis of pre-fire forest management could be used to prioritize where, in watersheds, the greatest reduction in erosion can be gained from efforts designed to reduce fire intensity.
Figure 11. Subtracting the pre-treatment erosion prediction from the post-treatment (e.g., thinning and prescribed fire) yields an “erosion difference” map that could be used to highlight where the greatest benefits could be achieved (sediment savings). Additional factors could be added such as road drainage diversion potential (post fire), road surface erosion potential and the spatial locations of all these factors with respect to high quality and sensitive fish habitats (see natural resource application guide for additional information). Negative values indicate where erosion has increased following treatment.