TODO: To change the footer's content go to Dr.Explain menu Options : Project Settings : HTML (CHM) Export : Setup HTML Template and Layout
Delineate Riparian Zones
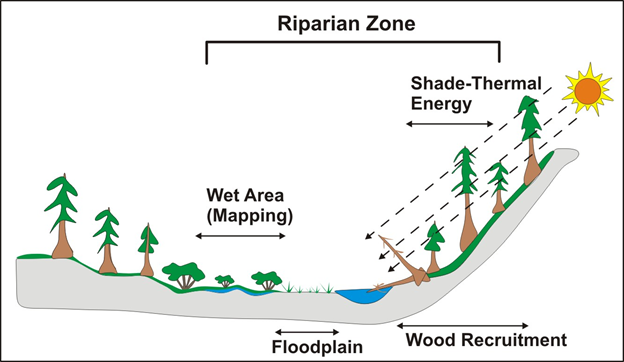
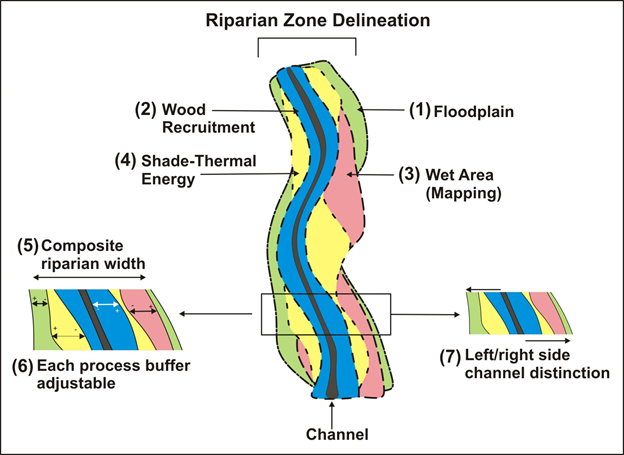
Figures 1 (left) shows the four riparian processes that can be included in NetMap's riparian zone delineation tool (any combination of the four can be used, including only one). Figure 2 (right) illustrates how the riparian zone delineation tool works. Based on variable site to site channel-riparian environments and the contraints imposed by analysts (number of riparian processes selected and on the lateral limitations imposed, e.g., #1 - #6), the mapped riparian zone, by process, will vary along the channel and across a watershed, with left channel - right channel distinction (#7). Then for each reach in NetMap's synthetic stream layer, a single maximum of riparian zone extent is created (#5).
Examples follow.
Figure 2. Each riparian zone process is delineated (polygons), as shown above, and then combined (lower right panel). The lateral extent of each process can be adjusted by the analyst including setting thresholds for wet areas (depth to water, in this example less than 15 cm and maximum lateral extent of 30 m), floodplains (mapped at an elevation equivalent to two multiples of bank full depth and a maximum lateral extent of 30 m), and in-stream wood recruitment (100% wood recruitment included, but can be adjusted to be less than 100%).
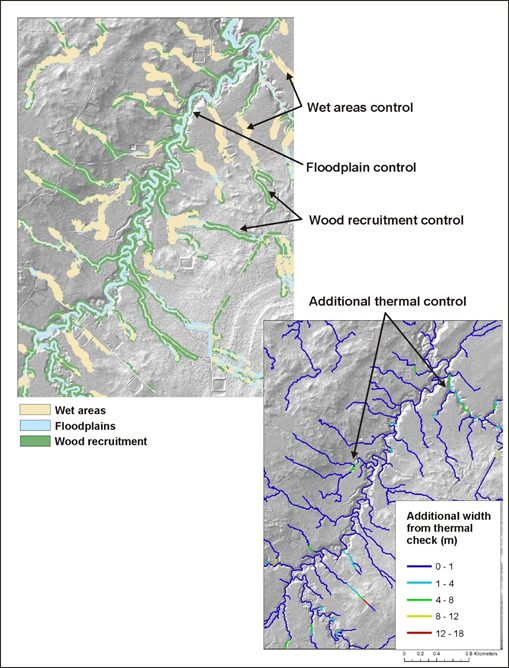
Figure 3. In a spatially variable riparian zone, wet areas control it in some areas, floodplain in other areas, and in-stream wood recruitment in yet other areas.
Thermal in-stream sensitivity can also be a factor in a subset of channel reaches.
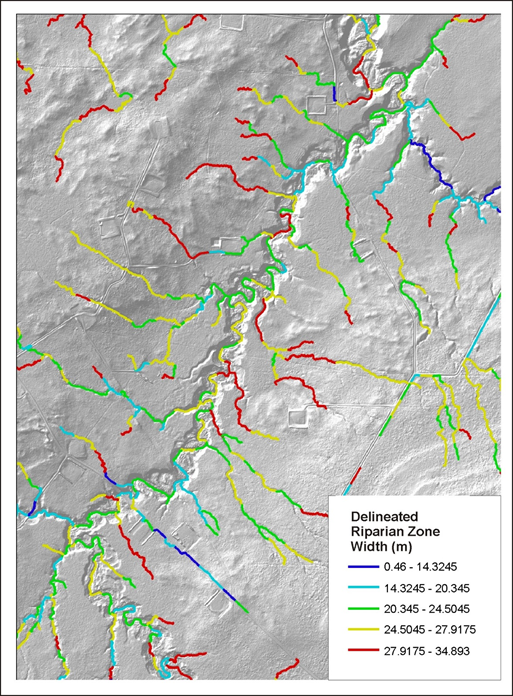
Figure 4. The width of delineated riparian zones varies from less than 14 m to 35 m, depending on the spatial variability in riparian processes, including wet areas, floodplains, wood recruitment and thermal loading.