TODO: To change the footer's content go to Dr.Explain menu Options : Project Settings : HTML (CHM) Export : Setup HTML Template and Layout
Identify Highest Priorities
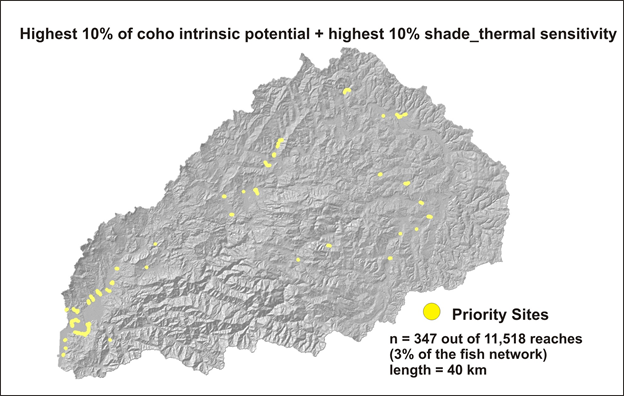
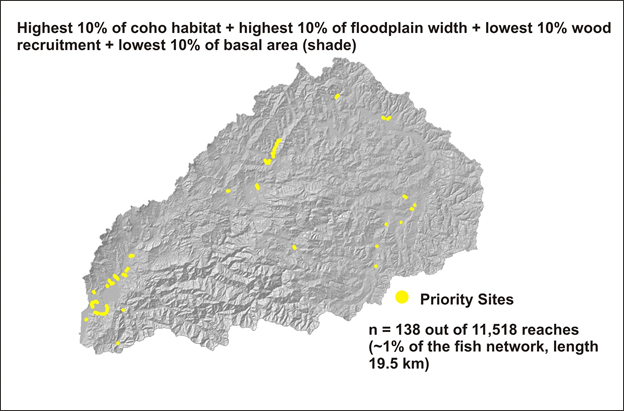
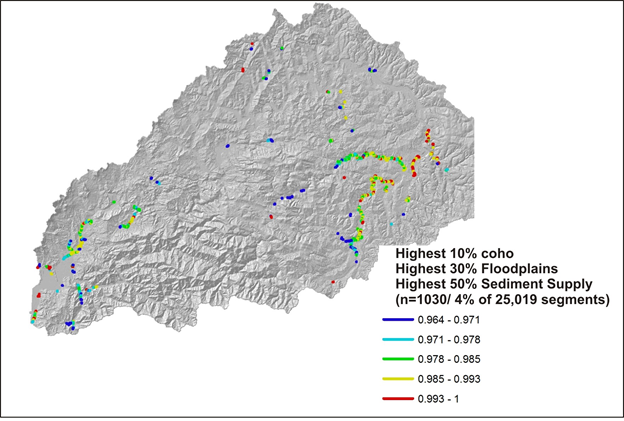
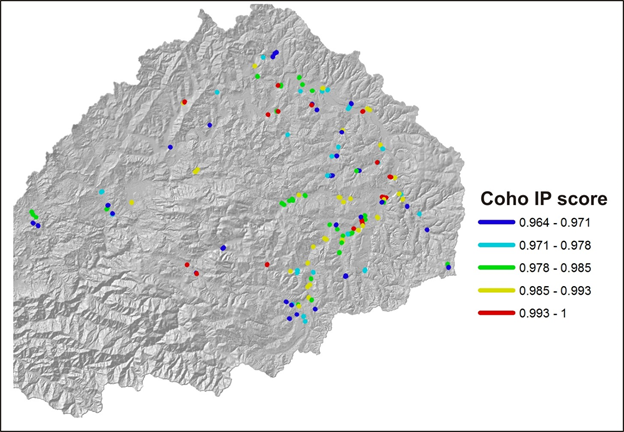
Some examples:
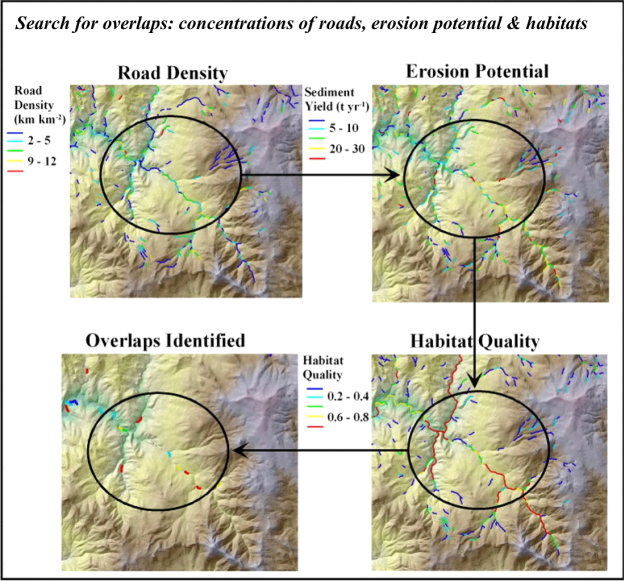
Figure 1. Some examples of running NetMap's overlap tool. To see the full analysis in support of watershed restoration, see here for self guided PPT-PDF and here for the video.
Figure 2. An illustration in the use of NetMap’s overlap tool shows how Road Density (calculated at the scale of individual channel segments, using Drainage Wings, is overlaid on the inherent erosion potential of hillsides (using Generic Erosion Potential), and which is further overlaid on fish habitat quality (Intrinsic Potential). A user selects threshold values for these three attributes (e.g., top 10%, top 5%, top 1% etc.) using the Overlap Tool, and reaches where these thresholds overlaps are identified (and in this example, color coded by fish habitat quality). Hence an analyst can quickly identify where in a large watershed, the greatest potential exists for road related impacts on habitats, are located. Field programs or restoration activities can be tailored to match these findings.
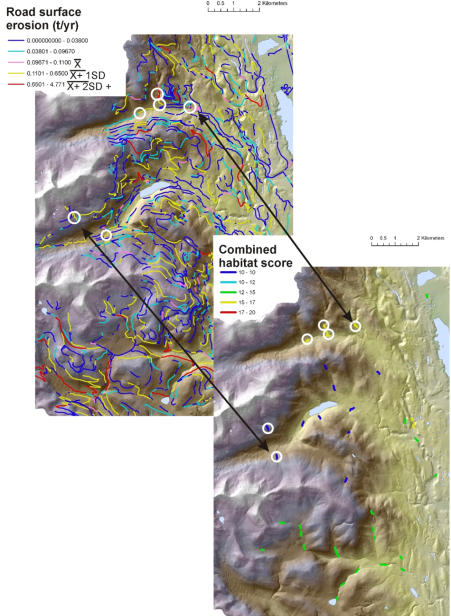
Figure 3. An example result of using NetMap’s overlap tool where road surface erosion in streams is compared to a combined habitat score for Bull and Cutthroat trout. For additional information about this analysis in western Montana, see Road Surface Erosion.
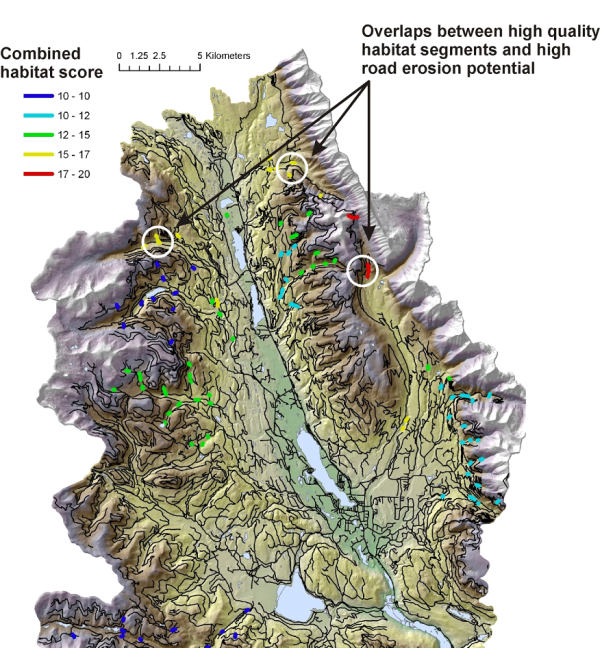
Figure 4. The map display shows the combined aquatic habitat score, where there are overlaps between the top 5% of road surface in streams. A user could apply this approach to prioritize where to conduct additional field surveys of road conditions and for developing road restoration strategies. For additional information about this analysis in western Montana, see Road Surface Erosion.