TODO: To change the footer's content go to Dr.Explain menu Options : Project Settings : HTML (CHM) Export : Setup HTML Template and Layout
Fish Habitats
Includes Habitat Intrinsic Potential Models for:
-coho salmon
-Chinook salmon
-steelhead
-Westslope cutthroat trout
-Bull trout
Figure 1. Fish habitats are mapped at multiple scales.
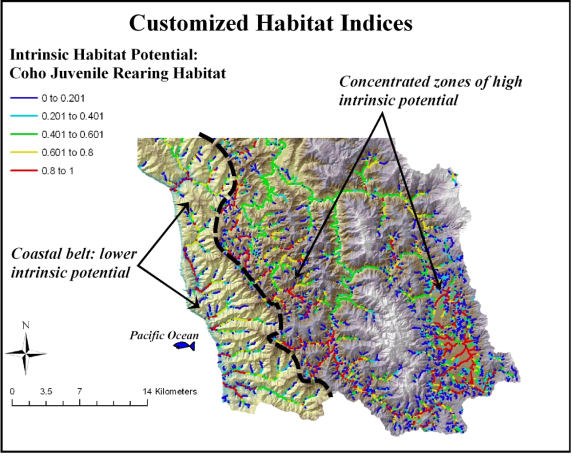
Figure 2. NetMap’s habitat creator tool allows users to examine and visualize the varying spatial distribution of different habitat types (by species) in a watershed. A user can analyze how different landscapes lead to different spatial distributions of habitats. The example shown is from northern California and it shows low habitat potential for coho salmon along the narrow and steep coastal belt of mountains and a much expanded habitat potential in the upper reaches of the Russian River.
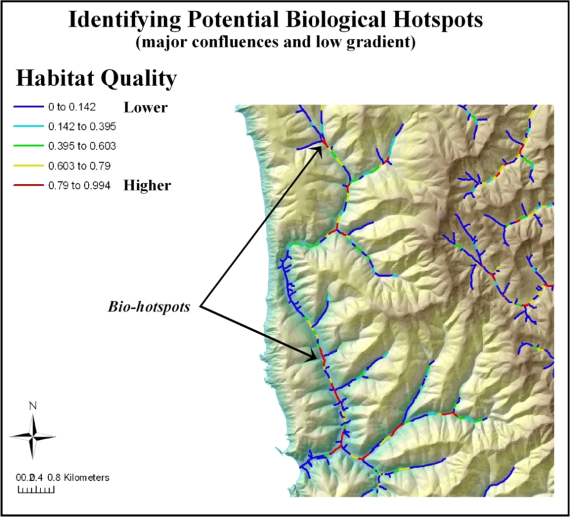
Figure 3. NetMap’s Create Habitat Indices tool is used to predict “biological hotspots”. In this example, hotspots are defined as the convergence of major confluences with low gradient channels with wide floodplains.
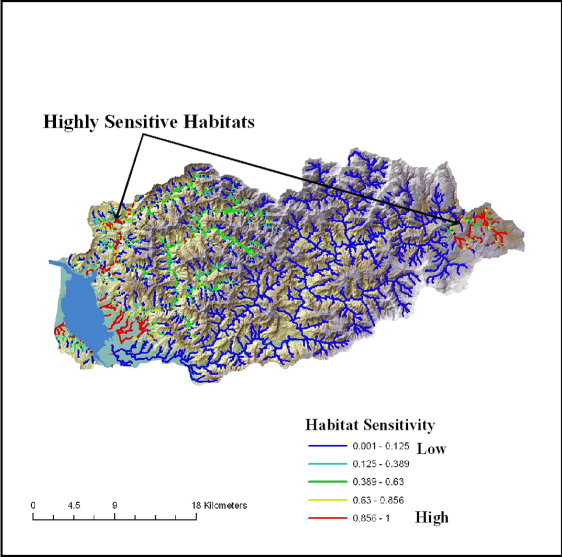
A parameter called “habitat sensitivity” can be developed using the same model. Habitat sensitivity can involve channel criteria such as channel gradient, drainage area, and confluence effects (Figure 5). A model based on these and other related channel attributes can indicate those channel segments that are sensitive to influxes of sediment from hillslope erosion, etc. A user can also add hillslope parameters that may relate to the potential for a channel to change its morphology, such as erosion potential (GEP), debris flow potential (at junctions in fish bearing streams), fire risk, burn severity or road density. A user may also create a channel sensitivity index and then use NetMap’s ‘Overlap Tool’ to seFieldh for juxtapositions between risky hillslope conditions and channel sensitivity.
Figure 4. The parameters of channel gradient, floodplain width/channel width, and local sedimentation potential are used to predict habitat sensitivity in the Wilson watershed in Western Oregon.
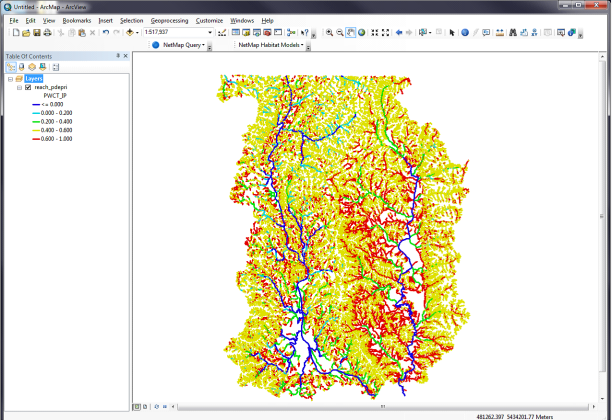
Figure 5. An example of mapped Westslope Cutthroat trout. Red color code indicates high intrinsic potential for West slope cutthroat trout.