| < Previous page | Next page > |
Current Shade-Thermal EnergyShade and its Effects on Thermal Loading
Tool Description: This tool allows one to calculate current shade (0% to 100%) using remote sensing data on vegetation (LEMMA) and using a model that couples vegetation basal area with tree height (Groom et al. 2011). Coupled with NetMap's thermal loading tool that calculated bare earth radiation, NetMap's Shade-Thermal Loading Tool calculates the amount of solar radiation (watt-hours/m2) into streams based on current vegetation basal area, tree height, channel width, channel orientation, topogrpahic shading and solar angle. The tool also allows an estimation of the difference between current shade-thermal loading conditions and shade-thermal loading conditions using some maximum estimated shade conditions. This latter prediction can be used to identify areas where riparian restoration could be applied to increase shade and reduce thermal loading into streams.
NOTE, prior to running this tool, you will need to access and process Vegetation Data, such as LEMMA (see Tool).
Data Type: Line (stream layer)
Field Name: SolShd; Common Name: Current shade thermal energy (to streams)
Field Name: SolBare; Common Name: Bare Earth Solar Radiation
Field Name: SolMean; Common Name: Current shade thermal energy, averaged downstream
Field Name: SolDifShd; Common Name: Solar radiation difference (vegetated – bare)
Field Name: SolShdMax; Common Name: Maximum shade (either basin maximum or user specified)
Field Name: SolDifMax; Common Name: Difference beween the current shade thermal energy and estimated maximum shade- thermal energy (provides an index of where increasing shade would have the greatest benefit)
Field Name: shdLeft; Common Name: Current shade value, left side of channel (0-1)
Field Name: shdRight; Common Name: Current shade value, right side of channel (0-1); 1 = complete shading, 0 = no shading
Units: Watt-hours/m2
NetMap Module/Tool: Vegetation/Fire/Climate - Vegetation - Shade/Thermal Load - Current Shade-Thermal Loading
Model Description:
Streams and rivers without vegetative shade are exposed to full sunshine (direct and indirect radiation, and see NetMap's "Thermal Load Sensitivity" tool). Vegetative shade ("shade" can be described as the inverse of solar radiation and can be calculated as a percent, from zero to 100, of the amount of direct and indirect solar radiation that is blocked). To calculate the effects of vegetative shading on streams and rivers, we first start with a calculation of radiation with no shade, or what is referred to as "bare earth" radiation, and this parameter is predicted by NetMap's Thermal Load Sensitivity Tool (Figure 1). Bare earth radiation into streams (watt-hours/m2) is controlled by the solar angle, the time of year, channel width, channel orientation (azimuth) and topographic shading, to learn more see NetMap's "Thermal Load Sensitivity" tool.
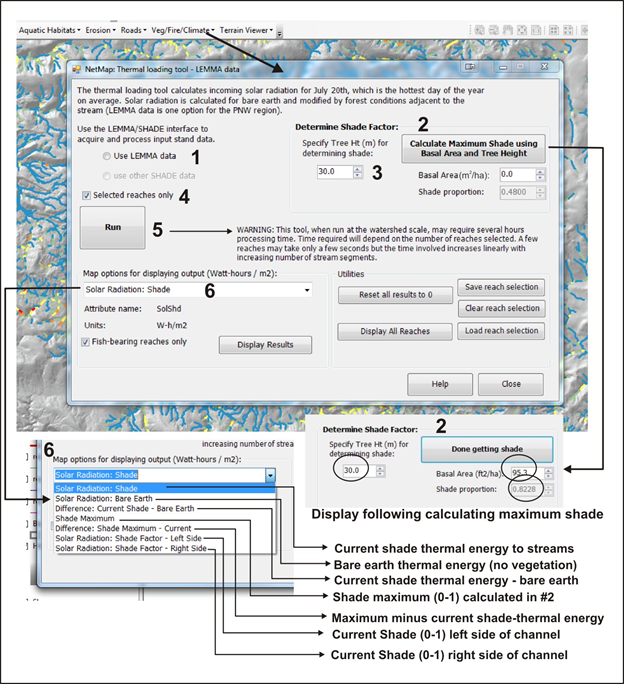 Figure 1. (1) Select which data type you want to use (LEMMA is available in WA, OR, CA), but you must first access the data or import your own using NetMap's "Get Vegetation Data" tool. (2) A user needs to select a maximum shade value to compare to existing shade-thermal energy values (this allows one to estimate the effect of increasing shade along any stream reach); (3) a user FIRST sets the tree height (m), 30 m is the default. Pressing #2 yields the maximum shade value (see lower inset) and the associated basal area value. A user can modify either the tree height or the basal area and arrive at a new maximum shade value. (4) Select indiviual reaches or run across an entire NetMap dataset (note, running entire datasets could take several hours, so you might wish to run overnight). (5) Run the Shade-Thermal Energy tool. (6) Select from seven different types of outputs. See below for examples of the Shade-Thermal tool.
NOTE, prior to running this tool, you will need to access and process Vegetation Data, such as LEMMA (see Tool).
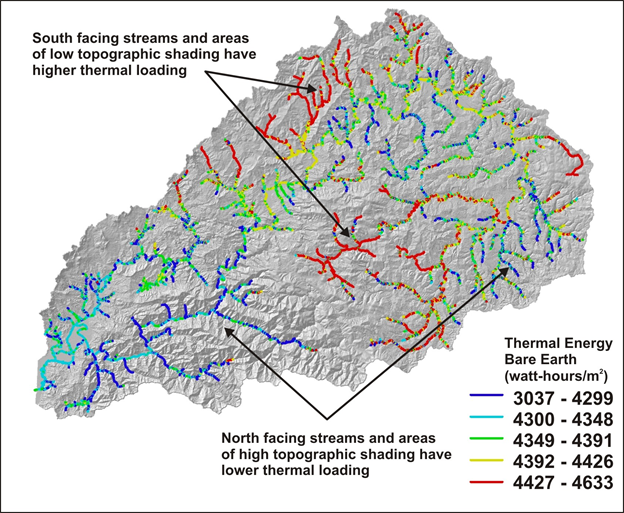 Figure 2. Using NetMap's Thermal Load Sensitivity Tool, this figure shows a prediction of bare earth solar radiation into streams in the Nehalem watershed in northwestern coastal Oregon. Bare Earth thermal energy is then reduced by current shade estimates (see below).
There are different methods to predict how stream side vegetation results in shade. Here we use a model that incorporates vegetation basal area and tree height (Groom et al. 2011). The empirically based, statistical model developed in coastal Oregon predicts that percent shade in positively correlated to basal area (e.g., the denser the vegetation the greater the shade) but inversley related to tree height (the taller the trees, the less shade) (Figure 3). This rather non intuitive inverse relationship between tree height and shade appears reasonable if one considers that as trees grow taller, as in a conifer forest that is mature or very old, there are more open canopies and less along-stem vegetation. Conversley with shorter vegetation, canopies can be closer together and there may be greater along-stream vegetation. However, it is important to keep in mind that the shadow cast by taller trees (the area of a stream that is effected by shade) increases with vegetation height (see Figure 2 for an illustration of these patterns).
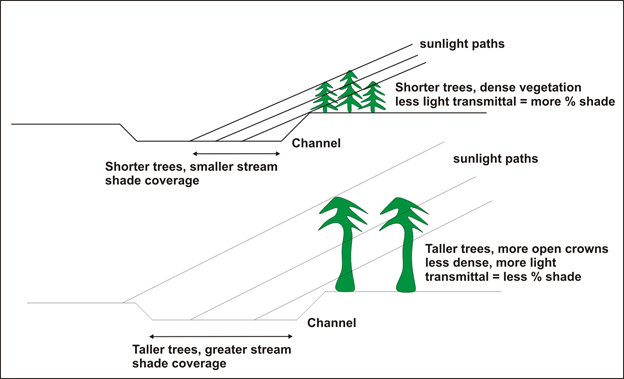 Figure 3. The shading and shadow relationships between shorter and more dense vegetation compared to taller and more open vegetation.
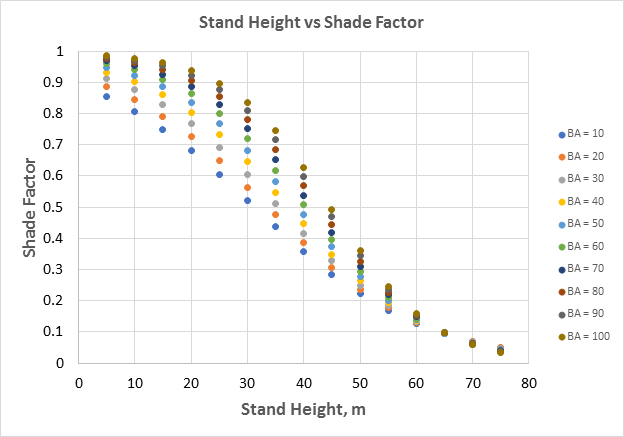 This figure shows the relationship between shade in the Groom et al model and stand height. The field data based statistical model predicts that shade decreases with increasing tree height - the field data from dense second growth forests to more open old growth provide that relationship. Consider that shade is highest within a to dense blackberry bushes and in dense second growth forests where no understory can thrive. But in a more open old growth forest canopy there is a fair amount of light coming through with plenty of understory - the difference in light (or shade) is about 80% (plot); but if you were to compare even the lowest shade factor of 0.1 with a situation of no shade in a farm field or a three meter high bush shade next to a 10m wide channel, there would still be a large difference in shade factor between that and tall trees (the lowest might be 0.001 - 0.01).
To run NetMap's Current shade-thermal loading tool requires remote sensing (GIS) data on basal area and shade. LEMMA data can be used in Washington, Oregon and California; in areas outside of that region or if users have their own spatial data they can use that in the model, but the data must be in the same format as LEMMA. See examples of LEMMA data on basal area in Figures 4 and 5.
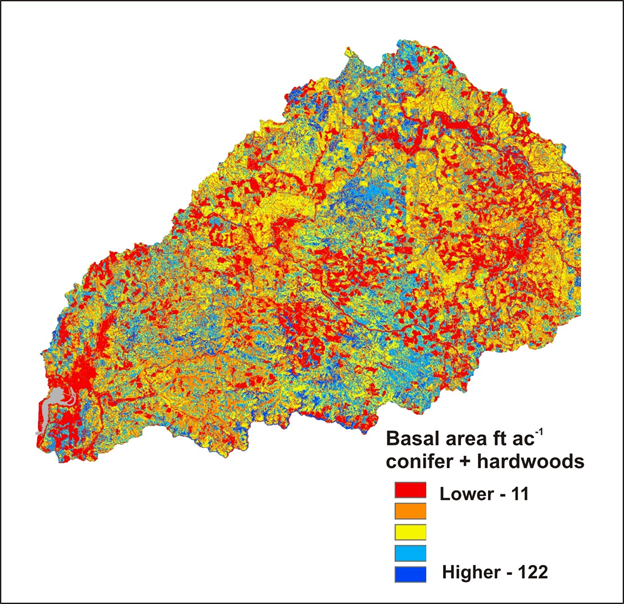 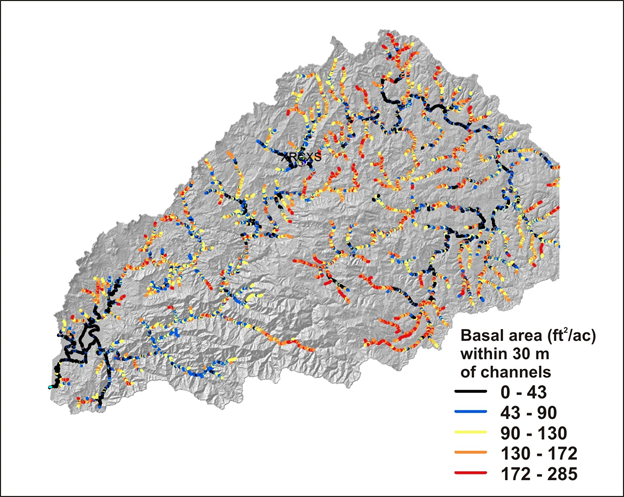 Figures 4 and 5. Spatial data (gridded, raster) on basal area in the Nehalem watershed (LEMMA) and basal area within 30 m of channels mapped to stream reaches (shown are salmon bearing streams only, from ODFW).
Using predictions for bare earth thermal energy to streams and the shade model, NetMap predicts the thermal energy load to streams and rivers based on current shade conditions (using basal area and tree height, Figure 2). An example of the model output is shown in Figures 5 and 6.
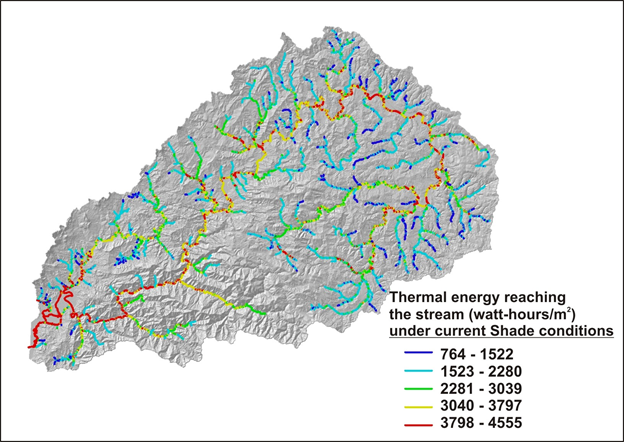 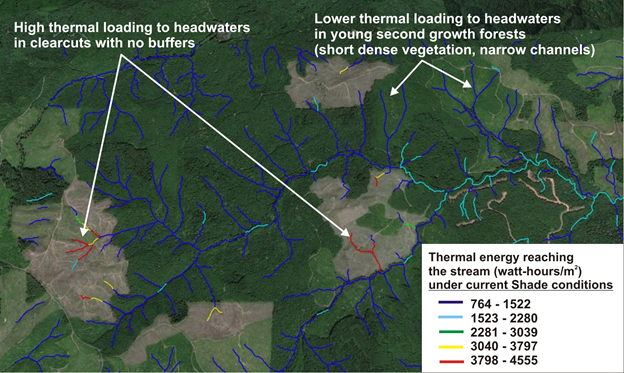 Figures 6. NetMap's predicted current thermal energy to streams and rivers under current shade conditions in the Nehalem watershed. The warmer colors indicate channel reaches with higher thermal loading conditions; only the salmon fish bearing potion of the network is shown. Figure 7 shows the predictions for headwater streams exported to Google Earth using a tool in NetMap (Google Earth Exporter).
In a watershed many channels will not have their maximum shade potential because of current land use practices including forestry, agriculture and urbanization and the history of these and other factors such as wildfires. It could be important to know, in terms of restoring shade, which channels would benefit most from increasing riparian shade. Thus, NetMap's current shade-thermal energy tool includes a feature for a user to calculate the conditions of maximum shade (comination of tree height and basal area, although keeping in mind that shade is inversely related to tree height, see Figure 3). The tool will search, in any watershed, for the maximum shading condition (0-1, e.g., zero to 100%) and report the associated basal area and tree height values; however, a user can adjust the basal area and tree height values to either increase or decrease the calculated shade values. Then the tool recalculates the thermal energy load to the stream using the maximum shade value (everywhere) and then calculates the difference between the maximum predicted shade-thermal energy and the current shade-thermal energy. The difference value provides information for where increasing shade will have the largest effect on channel thermal energy conditions.
 NOTE: Some small streams with tall old growth trees were predicted to be places where shade could be increased and thermal loading correspondingly decreased using some estimate of a theoretical maximum tree height and basal area. This is correct in terms of the model: old forests with tall trees can have lower shade compared to what one could posit for a theoretical maximum shade in a watershed. In other words, dense second growth forests could have higher shade along narrower streams compared to older forests (and increasing tree height becomes less relevant in narrow streams).
Obviously, this is not relevant to identifying sites where additional shade would benefit the stream from a restoration perspective. So, one way to produce maps that acknowledge this, is to filter out all stream segments that are bordered by large and tall trees (mature or old forests) and remove them from consideration; thus the map will only contain stream segments where there is not much vegetation (agriculture areas) and where additional shade would be effective. Also note, that adding shade to wide rivers will not result in significant reductions in thermal loading, since most thermal load is from the sky view.
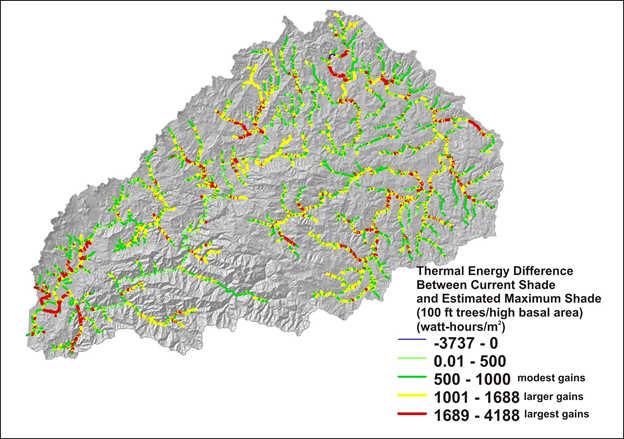
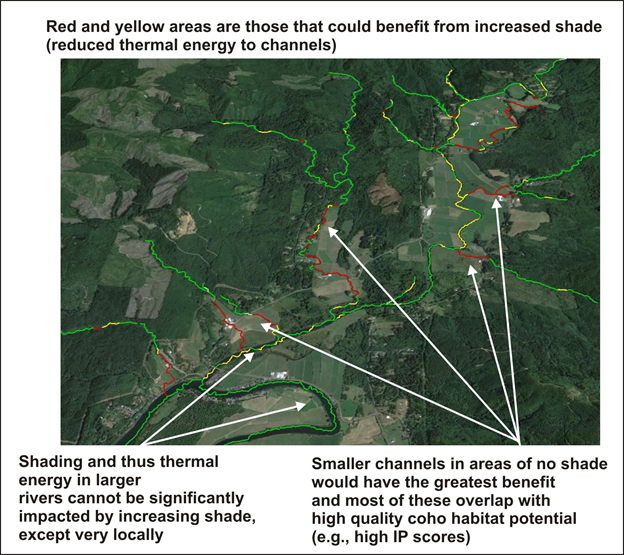 Figure 8. The predicted difference between a global, watershed wide shade factor of 0.87 (87%) corresponding to a maximum basal area of 122 and a tree height of 30 m. The warmer colors (yellows and red) indicate where increasing shade will have the largest effect at reducing thermal loading. Figure 9. Predictions exported to Google Earth show how the smaller channels (although high coho intrinsic potential fish habitat potential) within agricultural areas (with little stream side vegetation) would gaim the most from increasing shade conditions, where as the larger rivers would have have very large effects, considering the larger channel widths.
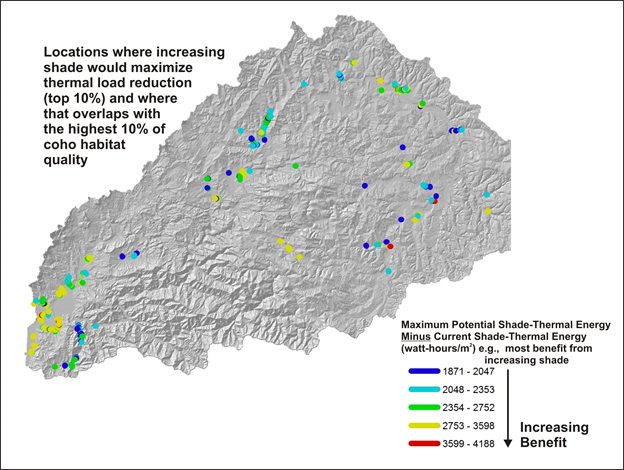
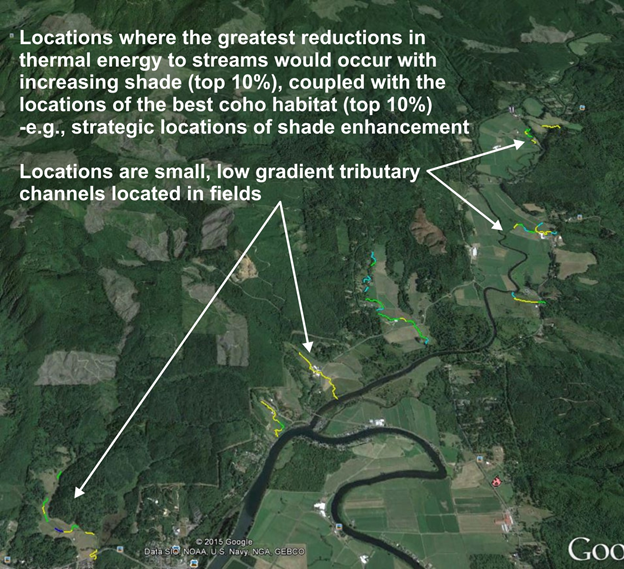
Example Application of Locating the Most Strategic Locations for Increasing Shade
  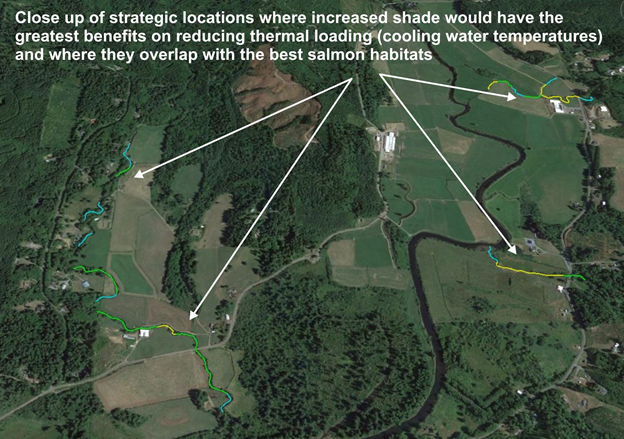 The contents of Current Shade-Thermal Energy |