| < Previous page | Next page > |
5.5 Surface Erosion-Veg/FireSurface Erosion - Vegetation/Fire (subscription only)
Parameter Description: The susceptibility of hillsides to surface erosion and the potential of sediment to enter stream channels are governed by hillslope topography (gradient, profile, proximity to a channel), vegetation (or lack thereof, via wildfire), soils and climate. Susceptibility to surface erosion in non fire and post wildfire situations is predicted in NetMap using the WEPP Disturbed model. The spatially explicit version of the WEPP model can be used to evaluate four situations: (1) no fire (surface erosion potential for unburned conditions using mapped vegetation classe), (2) Pre Wildfire (severity only) (surface erosion potential based on the most probable fire severity as predicted by WWETAC FireSim; FireSim predicted flame lengths (fire intensity) are grouped into three severity classes of High, Moderate and Low), (3) Pre Wildfire (burn probability combined with fire severity) (long term erosion regimes (frequency - magnitude distributions) that include both unburned and burned conditions (natural climate) over periods of a couple of hundred years (e.g., long term stochastic sediment budget) and (4) Post Fire ( post-fire erosion (severity) with a user-provided land cover layer that includes actual fire severity values (e.g., as contained within a Burned Area Reflectance Classification [BARC] map)).
Users with their own land cover and soils data may require TerrainWorks to do some pre-processing of their data, contact TerrainWorks for details. Contact us.
Data Type: Line (stream layer - reaches) and hillside polygons (drainage wings)
Hillside Polygon: wingpoly_dataset name.shp; Field Name: WEPPSlop
Reach Field Name: WEPP; Common Name: WEPP Yield-t/yr
Reach Field Name: WEPP_Cum; Common Name: WEPP Yield-t/km2/yr - Cumulative
Units:
NetMap Module/Tool: Erosion
Model Description:
The Water Erosion Prediction Project (WEPP) is a physically based erosion model developed by a group of US Federal Agency scientists: the Agricultural Research Service, US Forest Service, Natural Resources Conservation Service, Bureau of Land Management, and the US Geological Survey. WEPP contains modules that account for the processes of surface hydrology, winter hydrology, water balance and percolation, soils, plant growth, plant residues, and hillslope surface erosion. Cligen is used to simulate weather to run the erosion calculations. WEPP (Disturbed) was integrated within NetMap’s Digital Hydroscape where hillsides are divided into “drainage wings”, local contributing drainage areas on either side of channel segments (Figure 1). Each drainage wing in NetMap is divided into three Overland Flow Elements (OFE); the OFEs are used to calculate surface erosion using WEPP, thus providing a spatially explicit analysis of the responses of multiple hillslopes to unburned land cover type, to postfire burn severities, and to pre-fire projections of burn probabilities and severities. WEPP is run in continuous simulation mode for 100 or more years.
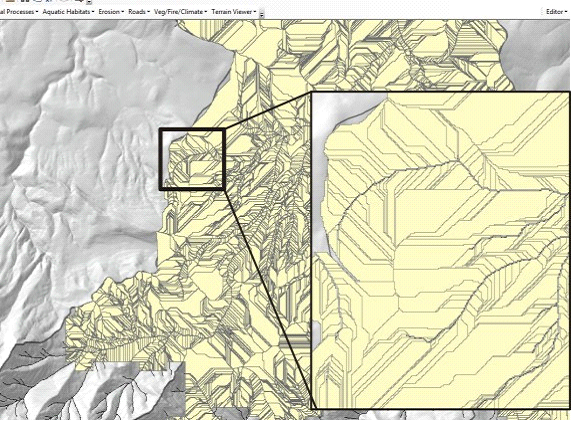 Figure 1. “Drainage Wings” in NetMap are used in the application of WEPP (Disturbed) for standard vegetated conditions, post wildfire and pre wildfire estimates of surface erosion.
15
WEPP-NetMap uses input files from Disturbed WEPP with the underlying WEPP engine. We recommend that users read the latest Disturbed WEPP documentation to understand how the inputs for climate, soils, and land cover are formulated and to understand model operations and assumptions.
Analysis Options and Management Applications
WEPP can be used to simulate erosion using four scenarios:
1) Non Fire: Predict surface erosion potential for unburned conditions using mapped vegetation classes; use default land cover layer (or provide your own but with the correct format).
Application: This option is used to consider land use impacts on erosion potential (such as logging or grazing etc.).
2) Pre Fire (severity only): Predict surface erosion potential based on the most probable fire severity as predicted by WWETAC FireSim; FireSim predicted flame lengths (fire intensity) are grouped into three severity classes of High, Moderate and Low (see Table below); Data from Western Wildland Environmental Threat Assessment Center (WWETAC) flame-length layers; available for the contiguous US only, i.e. not Alaska or Hawaii.
Application: Use this option for pre wildfire planning purposes to determine where, in a watershed, reductions in fuels and fire severity would have the largest beneficial effect in reducing erosion and impacts to water quality and fisheries. For analyses at larger scales (entire watersheds) see the “Fire Cascade” tool in NetMap (under the tab “Vegetation/Fire/Climate”). For regional or forest wide analyses of fire severity and erosion, go to the TerrainViewer (also located on the NetMap Add-in).
3) Pre Fire (burn probability combined with severity): Predict long term erosion regimes (frequency - magnitude distributions) that include both unburned and burned conditions (natural climate) over periods of a couple of hundred years (e.g., long term stochastic sediment budget) that utilize Western Wildland Environmental Threat Assessment Center (WWETAC) burn probability and flame-length layers and land cover for unburned periods; available for the contiguous US only, i.e. not Alaska or Hawaii.
Application: Use this option to consider the natural erosion regime that includes fires and to determine which areas of your watershed have highest potential for extreme erosion events.
4) Post Fire: Predict post-fire erosion (severity) with a user-provided land cover layer that includes actual fire severity values (e.g., as contained within a Burned Area Reflectance Classification [BARC] map).
Application: Use this option for post wildfire restoration such as during a Burned Area Emergency Response (BAER) effort.
Using the synthetic river network (stream layer) in NetMap, individual reaches (approximately 100 to 200 m in length) are selected by the user and NM will identify which hillslopes drain to these reaches (e.g., drainage wings). A WEPP simulation is run for each hillslope for 100 or more years and results are available to be displayed for reaches or hillslopes.
Four steps are needed to prepare and run WEPP before results can be displayed.
(1) Select Reaches: The user select reaches or NetMap will run all reaches in the dataset. WEPP runs for each reach reach and adjacent hillslopes (including writing and reading input and output files for WEPP) will take 3-10 seconds depending upon the number of hillslopes that drain to each reach. Because this can result in simulations that run for several hours, we recommend that WEPP is run on selected reaches only (not an entire NetMap dataset).
(2) Create Drainage Wings and Overland Flow Elements (OFEs): These are built reflecting specific combinations of require topography, soils, and land cover.
(3) Get Climate Information: Obtained from Cligen.
(4) Run WEPP: The WEPP surface erosion model is run with options that encompass the four erosion scenarios above.
Each of the four steps are outlined in detail below.
Step 1
Select reaches (using the select tool in ArcMap). It is advised that only a small subset of reaches (and associated hillslopes, via drainage wings) is selected for analysis. This is because the WEPP model is very time consuming (read and writing files) as well as the process of creating drainage wings and overland flow elements. It is recommended that only local areas are analyzed. For larger scale (watershed) analyses of fire severity and post fire erosion potential, go to the “Fire Cascade Tool” located in NetMap’s add-in under the tab “Vegetation/Fire/Climate”. For regional analyses of fire risk, go to the TerrainViewer online tool (also located on the NetMap add-in tool bar).
Step 2
If you do not plan to provide local GIS data, you will need to download WEPP GIS data from Tool Interface. These data are referred to as the default data in the instructions below.
NetMap calculates the slope gradients, lengths, and underlying characteristics of the digital drainage wing polygons by dividing each wing into overland flow elements (OFEs). Each OFE has a gradient, length, land cover type, and soil type. The default soil raster (soils_ID.flt) is derived from NRCS US General Soil Map (STATSGO) and contains four soil textures: 1 = clay loam, 2 = silt loam, 3 = sandy loam, and 4 = loam (see http://forest.moscowfsl.wsu.edu/fswepp/docs/distweppdoc.html#texture). Users can provide their own soil layer in floating point format (flt); the layer must be congruent with the NetMap data set elevation floating point raster (elev_ID.flt) and must have numbers that match the soil types as specified here: …NetMap_Files\WEPP|HashTables\cover_soil_hashtable1.txt.
Users can select one of three input types for land cover. (A) The default land cover raster (landcov_ID.flt) is derived from the National Land Cover Dataset (NLCD; URL) and Natureserv (URL); it contains 8 land cover/use types (grid code): mature forest (1), young forest (2), shrub (3), bunch grass (4), sod grass (5), low severity fire (9), high severity fire (10), pavement/developed (11), and moderate severity fire (13). The numbers associated with the soils textures and land cover types are matched to WEPP and Disturbed WEPP input files for the WEPP simulations (http://forest.moscowfsl.wsu.edu/fswepp/docs/distweppdoc.html#treatment ). Users can provide their own soil or land cover floating point layers (.flt) in the boxes; the layers must have an extent the same or greater than the NetMap data files (e.g., NetMap data set elevation floating point raster (elev_ID.flt)), have the same coordinate system (and projection) and must have numbers that match the land cover types as specified here: …NetMap_Files\WEPP|HashTables\cover_soil_hashtable1.txt. If different management files are used they need to be added to the cropfiles, rotfiles, inifiles, and Soilfiles folders.
(B) The two default probable fire severity layers (fsevlmh_ID, fsevlh_ID) are derived from WWETAC fire simulations. The probabilities for each of six flame length classes were collapsed into three grids representing low (<= 4ft), moderate (4 – 8 ft), and high (> 8 ft) fire severities or two grids representing low (<= 8 ft) and high (> 8 ft) fire severities (based on Hessberg et al. 2005, http://www.fs.fed.us/pnw/pubs/journals/pnw_2005_hessburg002.pdf). Grids were created representing the fire severity with the highest likelihood of occurrence for the three classes (low, moderate, and high) or two classes (low and high).
(C) BARC: Users can provide their own BARC Esri grid with the four standard codes: 1-4. They will need to select the BARC4 input button so that the data are properly processed to the land cover codes described above. 1=unburned; 2=low severity; 3=moderate severity; 4=high severity.
When ready, click on Create Drainage Wings and OFEs.
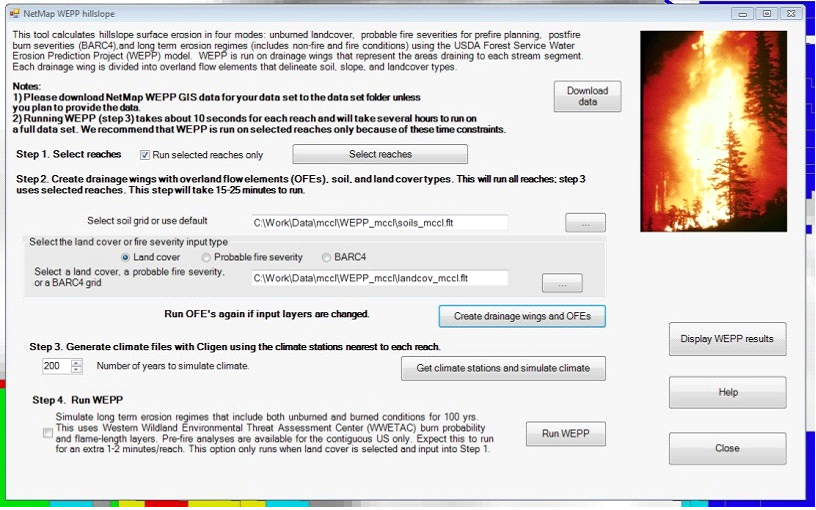 Figure 2. NetMap WEPP user interface.
Step 3
Climate files are necessary to simulate rainfall events and WEPP uses the Cligen climate model with climate information files stored in NetMap_Files\WEPP\Cligen\your state(s). You may need to unzip the xx.zip file to xx12345.PAR files for your state. It is generally recommended to run 200 years of climate data to use in a 100 year erosion simulation. NetMap uses the basins layer and a climate station layer to calculate which climate station data to apply to each reach for WEPP simulations.
Step 4
Run the WEPP model using one of the four scenarios listed above.
Users can choose to check the box labeled Run using WWETAC fire probabilities for pre-fire analysis (e.g., burn probability combined with severity) or leave unchecked. If checked WEPP will be run 3 times for each drainage wing using unburned land cover, low severity, moderate severity and high severity fire (or low and high severity only). These values will be combined with fire probabilities and flame lengths to calculate cumulative distribution functions of sediment for each wing and reach. Seven percentile values (25, 50, 75, 90, 95. 99, 100) will be calculated. See below for additional modeling information.
Running WEPP with WWETAC burn probability combined with fire severity
For each drainage wing, WEPP calculates sediment delivery to the base of the drainage wing (i.e., and into the stream channel) for each storm event generated by CliGen. Sediment delivery associated with storm events for each simulation year is summed to give a total annual sediment delivery to the base of the wing for each simulated year. Note that a 100-year simulation does not represent a series of 100 sequential years, but rather a simulation of the same year – with the same unchanged land cover – 100 times. We can then ask, for a given set of land-cover conditions today (including stochastic fire), what is the probability of a specified annual sediment yield from each drainage wing over the next year. The answer is provided as a cumulative frequency distribution, from which we can specify the probability of a sediment yield less than or equal to a specified value, and we incorporate both the probability of a large storm (via CliGen) and the probability of a fire (via the WWETAC fire probability maps) into this result.
The WWETAC fire risk maps provide the probability of a fire in any year, divided into six flame-height categories. We translate the flame heights to fire severities corresponding to the WEPP input files for low-, moderate-, and high-severity fires (see above). For each drainage wing, WEPP is run for 100 (or more) simulation years for each severity level. If there were a low-severity fire today, this simulation estimates the probability of a given sediment yield (in terms of a cumulative frequency distribution) for any drainage wing for the next year; likewise for a moderate and high-severity fire. For each drainage wing, we obtain four cumulative frequency distributions of modeled sediment yield from WEPP; one for the case of no fire, one each for low, moderate, and high-severity fires. From the WWETAC maps, we also have four probabilities: that for no fire in any year, and that for a low, moderate, or high-severity fire in any year. The resulting cumulative frequency distribution for sediment yield is obtained by multiplying each curve by the associated probability and then adding them together.
For example, image that the WEPP results indicate that, if there is no fire over the next year, the probability of observing a sediment yield from a given drainage wing of 1000 kg or less is 0.9. Likewise, imagine that WEPP indicates that, if there were a low-severity fire today, the probability of observing a sediment yield of 1000 kg or less over the next year is 0.7, and 0.3 for a moderate severity fire and 0.1 for a high-severity fire. If the probability of a low-severity fire for the wing in any year is 0.05 (recurrence interval of 20 years), and the probability of a moderate-severity fire is 0.01 (recurrence interval of 100 years), and of a high-severity fire is 0.005 (recurrence interval of 200 years), then the probability of observing a sediment yield of 1000kg or less is 0.7*0.05 + 0.3*0.01 + 0.1*0.005 + 0.9*(1-(0.05+0.01+0.005)) = 0.88. Alternatively, one may translate this to the probability of observing a sediment yield of greater than 1000 kg, which if fires were not accounted for would be estimated as 10%, but with fires increases to (100%-88%) 12% in this example.
If the pre-fire analysis box is unchecked, WEPP will be run using the land cover, fire severity, or BARC information selected in Step 1.
Display
When WEPP has finished, click on Display WEPP results (Figure 3). If a simulation option has not been run (i.e., result files are not available), that display option will be disabled.
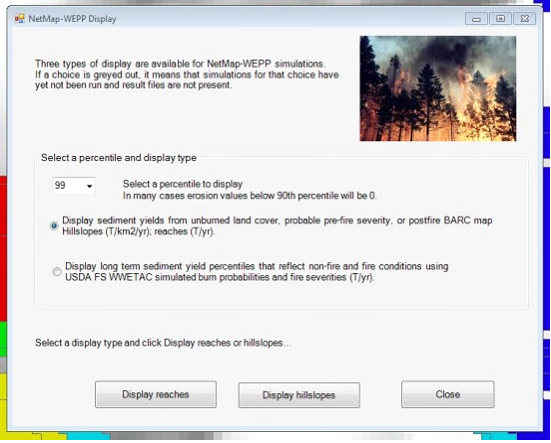 Figure 3. The Display user interface.
Two options are available for displaying reach and hillslope erosion at different percentiles (25, 50, 75, 90, 95, 99, 100): (1) unburned land cover, probable fire severity, or postfire BARC (e.g., scenarios 1-3) or (2) long term sediment probability distributions reflecting unburned and burned conditions (scenario 4), as modeled by WWETAC. Using WWETAC data for flame length, low fire severity occurs where simulated flame lengths are less than 8 ft. and high fire severity occurs where flame lengths were simulated at 8 ft. and above.
These options can be displayed for hillslopes (Figures below) or reaches (Figures below).
Result files are available for hillslopes:
Unburned land cover, probable fire severities, or postfire/BARC: rchWingQuantileByArea_lc_ID.txt (T/km2/yr)
Long term erosion regime (scenario 4): wingSedCDF_ID.csv (T/yr)
Result files are available for reaches:
Unburned land cover, probable fire severities, or postfire/BARC: PostFireReach_lc_ID.txt (T/yr)
Long term erosion regime (scenario 4):: reachSedCDF.csv (T/yr)
Units:
Example Applications
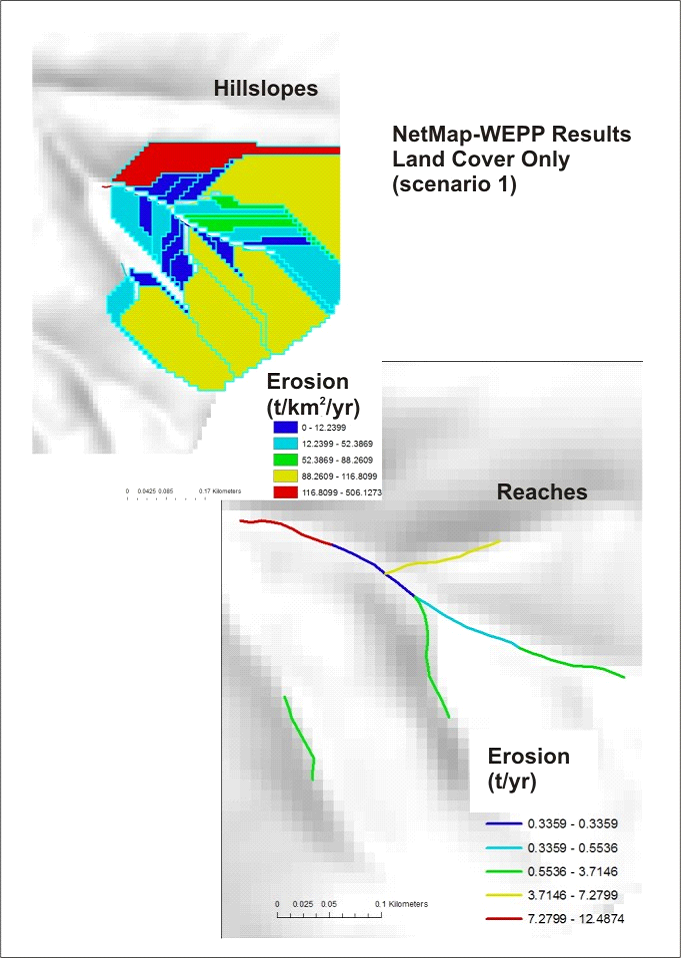 Figure 4. Results from using land cover only (application scenario 1).
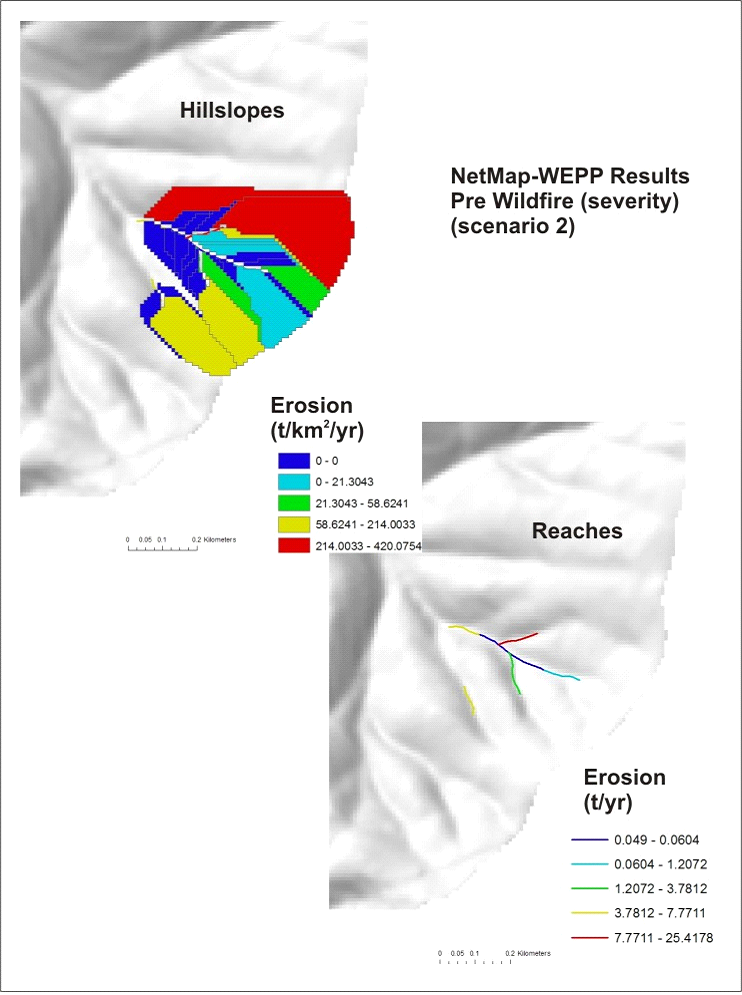 Figure 5. Results from WWETAC probable fire severity (e.g., predicted flame length in categories of High, Moderate and Low) (application scenario 2).
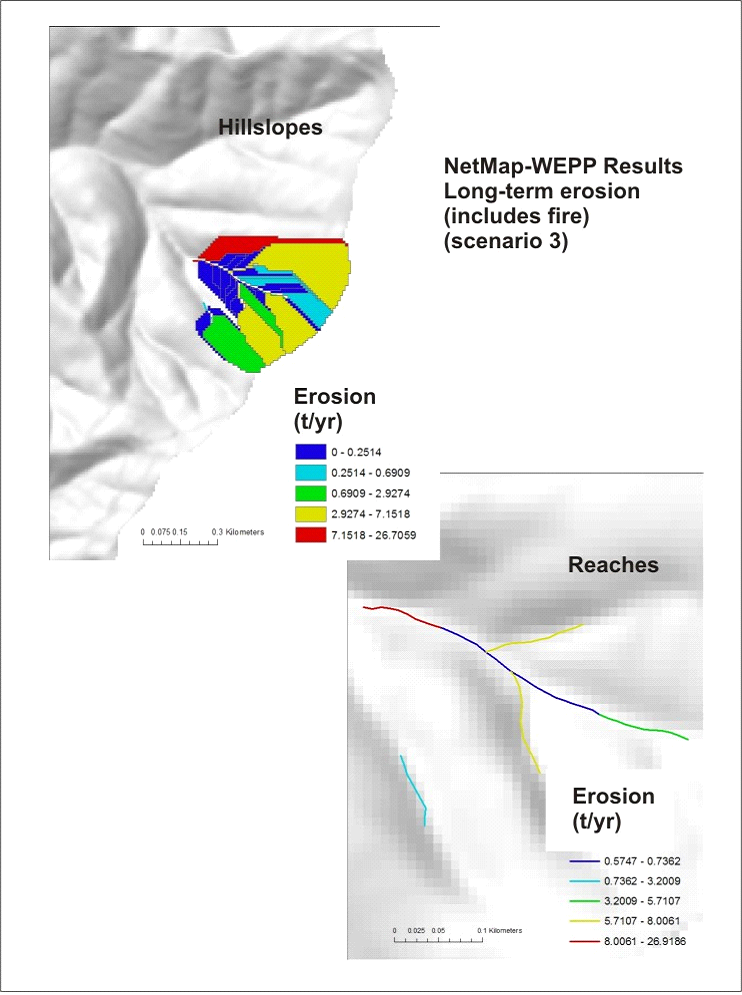 Figure 6. Results from WWETAC probable fire severity combined with fire probability and including non-fire periods to predict long term stochastic distribution of sediment yields (application scenario 3).
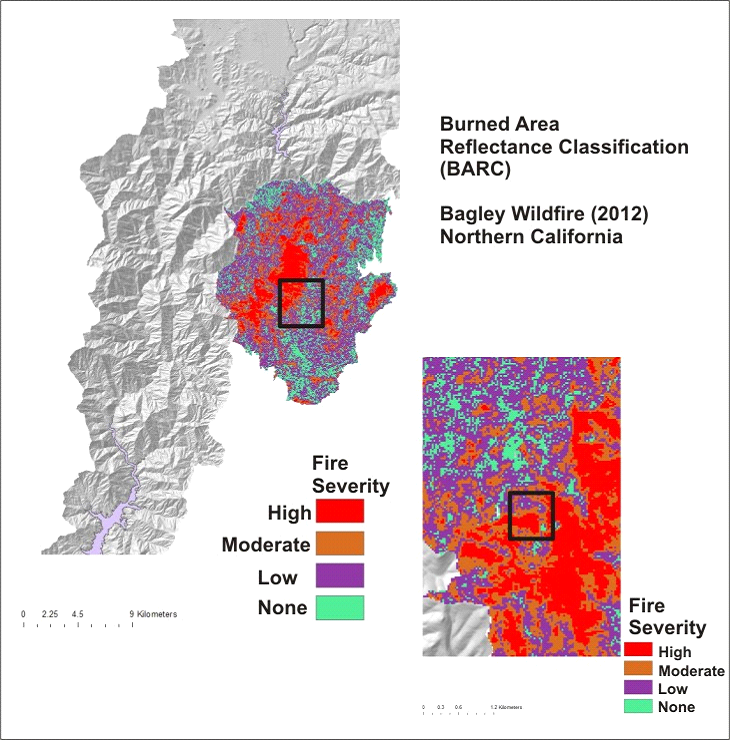 Figure 7. A burned area reflectance classification (BARC) map from the 2012 Bagley Fire in Northern California, used in the NetMap-WEPP tool (scenario 4). See Figure 8.
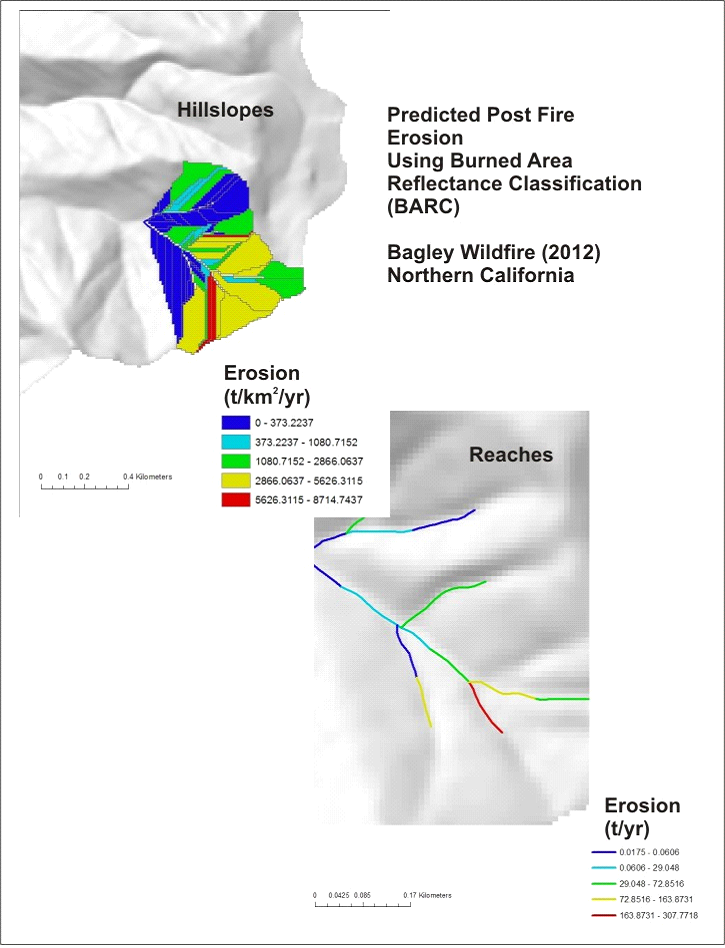 Figure 8. Results from using the BARC map (Figure 7) in the NetMap-WEPP tool.
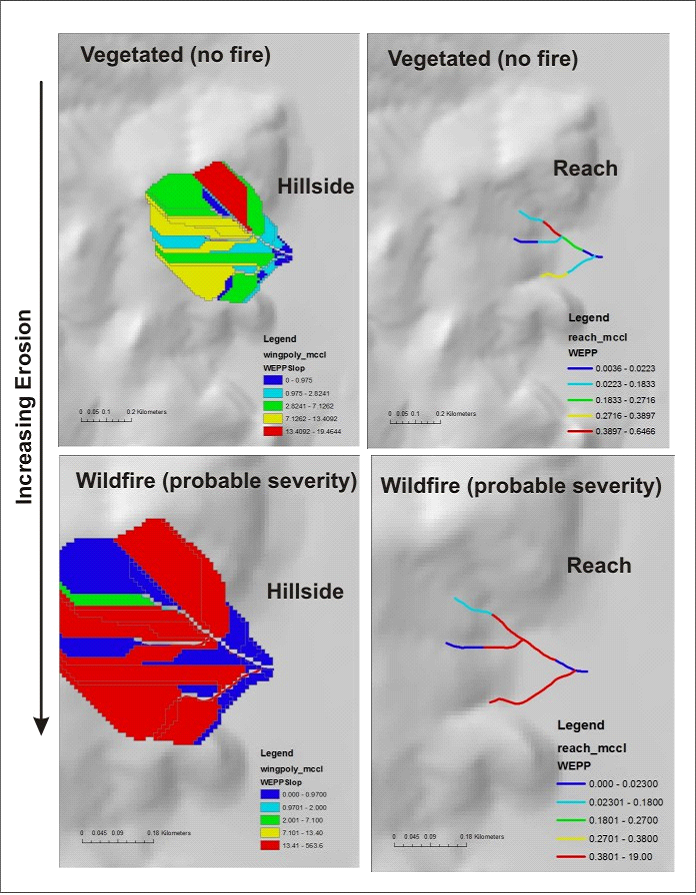 Figure 9. Results comparing vegetated conditions (no fire) erosion potential (upper panels) to wildfire conditions using the most probably fire severity (scenario 2). Note that large increases in erosion due to moderate and high severity fires.
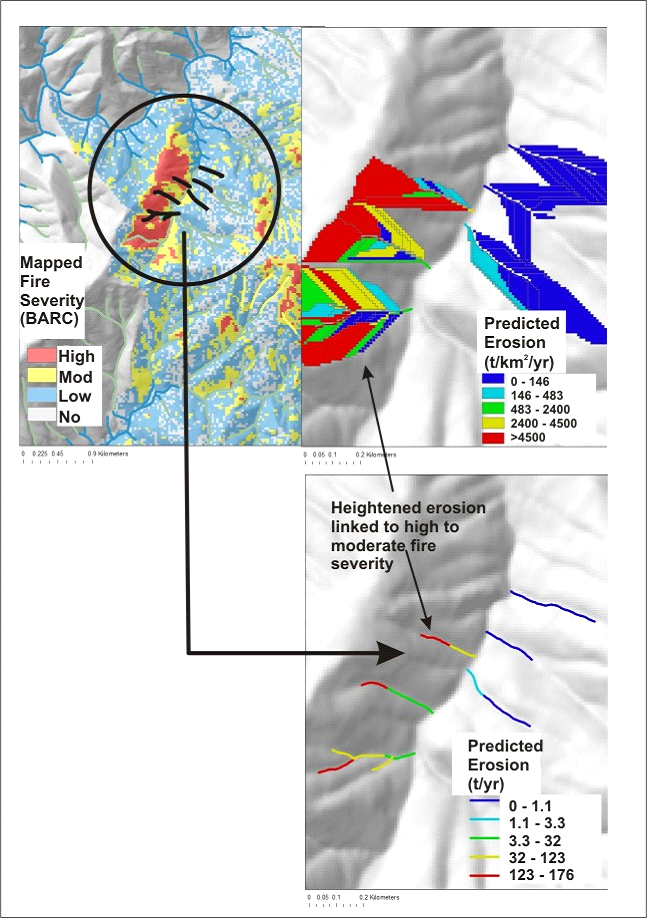 Figure 10. Results using a BARC map from the Bagley fire. The upper left panel shows the mapped fire severity (high, moderate and low). The upper right hand panel shows the predicted hillslope erosion. The lower right hand panel shows the predicted erosion in the stream channels. Note that the highest mapped fire severity (upper left hand panel) is associated with the highest predicted erosion potential (WEPP), on the hillslopes and in the channels. Area of low fire severity or no fires are predicted to have the lowest erosion potential.
More Technical Background/Applications:
One interesting application of NetMap-WEPP technology is in comparing the prediction of post fire surface erosion using present day vegetation (or fuel) conditions, as shown in Figure 2, with surface erosion following vegetation treatments that are designed to reduce fire intensity (thinning of dense stand of trees and/or prescribed fire). The predicted post fire erosion with present day vegetation conditions in the upper Sacramento River basin of northern California is shown in Figure 2. Results are shown for both hillslopes and sediment delivered to stream channels. A hypothetical thinning treatment was used to reduce vegetation density (and ladder fuels) that lessens fire intensity and corresponding flame length in certain areas in the same basin (Figure 3). A comparison between the two scenarios (without and with fuels treatment) shows areas where fuel treatment (thinning) would have the greatest impact for reducing post-fire surface erosion (Figure 4).
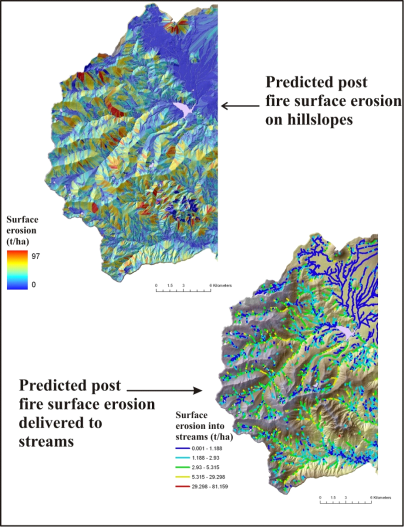 Figure 2. Output from the watershed-scale application of NetMap’s WEPP-based post fire surface erosion tool shows significant spatial variation in predicted hillslope erosion (top) and the delivery of that sediment to stream channels (bottom). The predicted flame length, based on current vegetation patterns in the Upper Sacramento watershed in northern California, was derived from Flammap, a federal agency fire hazard prediction model (http://www.firemodels.org/content/view/14/28/).
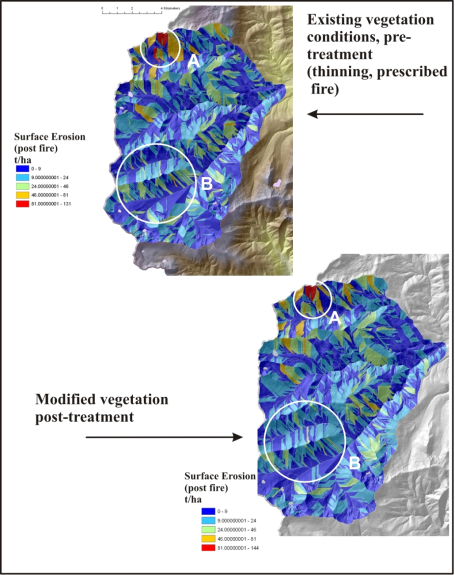 Figure 3. Comparisons between pre- and post vegetation treatment shows where surface erosion (following wildfire) is predicted to change.
An erosion ‘difference map’ can be produced, reflecting how pre-fire vegetation treatment may affect future, post-fire erosion events (Figure 4). This type of sensitivity analysis of pre-fire forest management could be used to prioritize where, in watersheds, the greatest reduction in erosion can be gained from efforts designed to reduce fire intensity.
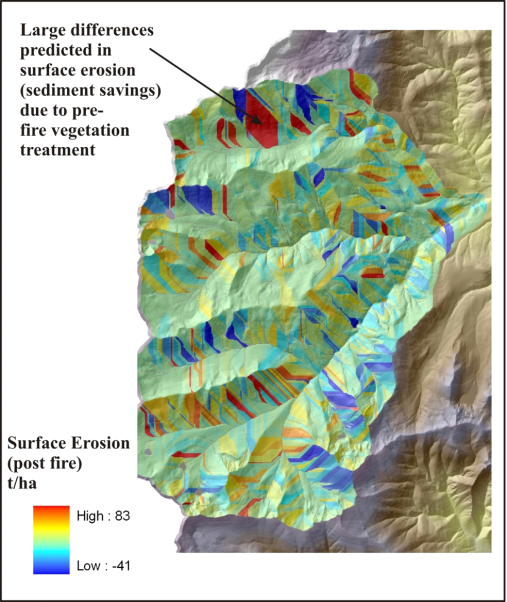 Figure 4. Subtracting the pre-treatment erosion prediction from the post-treatment (e.g., thinning and prescribed fire) yields an “erosion difference” map that could be used to highlight where the greatest benefits could be achieved (sediment savings). Additional factors could be added such as road drainage diversion potential (post fire), road surface erosion potential and the spatial locations of all these factors with respect to high quality and sensitive fish habitats (see natural resource application guide for additional information). Negative values indicate where erosion has increased following treatment.
ADDENDUM
How to join tables in ArcGIS
In the table of contents (TOC) right click on the shapefile to join a table to and click Open attribute table. Click on the first icon on the menu bar, select Joins and Relates, Select Join… (Figure 11)
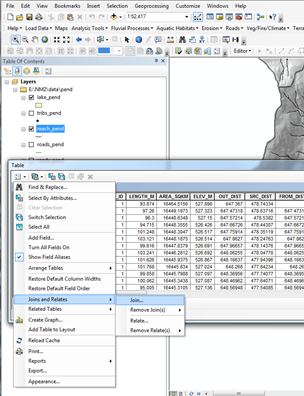 Figure 11. Open attribute table and select join
 15
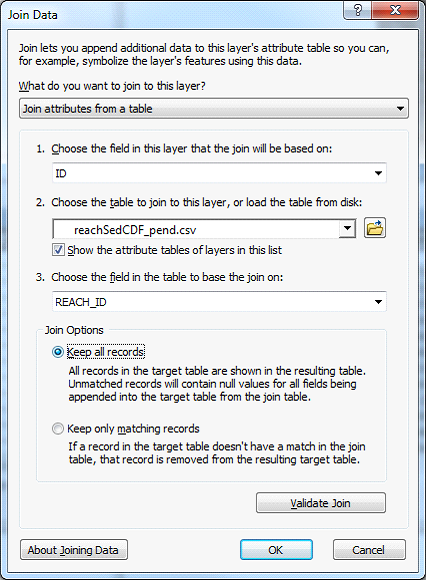
Figure 12. Select the field and tables to join sediment CDF data to reaches and wings.
Follow the step by step instructions on the form. The fields that the join will be based on for reach_ID.shp is ID and for wingPoly_ID.shp is ID. At step 2, browse to your_data_directory\reachSedCDF_ID.csv and select field Reach_ID to join to reaches. Or browse to your_data_directory\wingSedCDF_ID.csv and select field Wing_ID to join to wings. Click OK. (Figure 11)
Scroll to the right side of the attribute table to see the joined data fields. Pxx is the xxth cumulative percentile value of sediment for that reach or wing. These new fields can be selected and displayed in this map document (remember to save your map document). The join is not permanent and can be removed – see Figure 10.
|