| < Previous page | Next page > |
4.4 Habitat DiversityAquatic (Fish Habitat) Diversity
Parameter Description: An index of stream habitat diversity based on the heterogeneity of various stream parameters.
Data Type: Line (stream layer)
Field Name: HabDiv; Common Name: Habitat Diversity
Units: A numeric index
NetMap Module/Tool: Aquatic Habitats/Habitat Diversity
Model Description:
NetMap’s tool calculates the diversity of channel properties along a fixed width moving window along a channel network (Figure 1). The user selects from 2 to 4 parameters and NetMap calculates the normalized standard deviation from the population of individual channel segments (20 – 200m in length) that fall into a length scale (the minimum scale is eight channel segments and the minimum channel length to encompass this is calculated on the fly for specific watersheds). The output is a prediction of channel or habitat diversity.
.
NetMap’s Habitat Diversity tool allows a user to examine the spatial variation in various in-stream attributes ranging from a single parameter up to a combination of four. Variability is calculated using the standard deviation of watershed attributes, such as channel gradient that vary across a given spatial window (Figure 1). A minimum of eight channel segments (varying in length from 20 to 200 m) is used to calculate a normalized standard deviation within the specified length of the sampling window.
The user specifies whether the habitat diversity analysis is restricted to the fish-bearing portion of the network (1 in Figure 2). Next, up to four different parameters can be selected from the list (2, Figure 2). For example, floodplain width, channel gradient, and downstream decay of confluence effects can be combined to examine diversity. The user defines the length scale of the analysis (3, Figure21); NetMap calculates the minimum length of the sampling window based on the maximum length required to capture eight segments (the minimum number) within the target watershed. The result is a map of habitat diversity indicating channels of higher and lower heterogeneity (Figure 3).
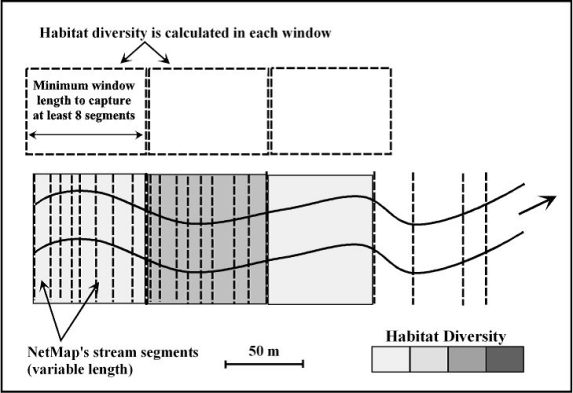 Figure 1. NetMap’s Habitat Diversity tool employs a user defined “window” that encompasses at least eight channel segments (of variable length). Within the sample window, the standard deviation is calculated for the specified parameters to create an index of habitat diversity.
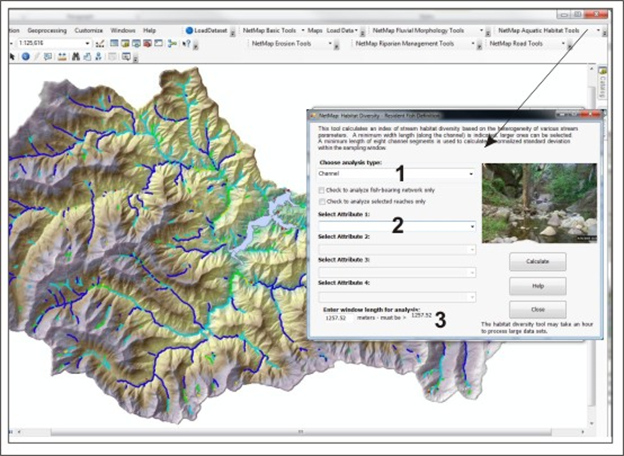 Figure 2. NetMap’s Habitat Diversity tool can be applied to channels or floodplains (1); for channels either at the scale of entire networks or just the fish-bearing portion. The user selects from one to a maximum of four parameters to include in the diversity calculation (2). The length scale of the sampling window is specified (3).
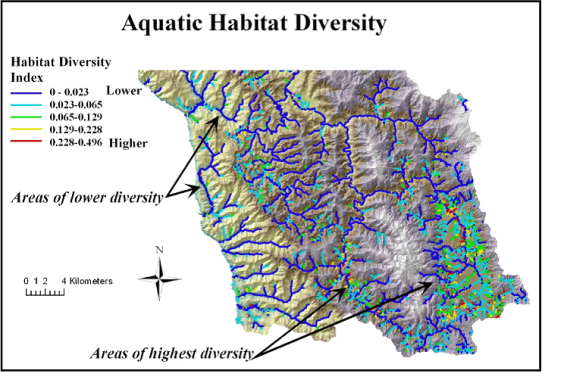 Figure 3. In this example the parameters of channel gradient, valley width, confluence effects, and near stream-roughness were used to estimate their combined standard deviation across multiple stream segments at a scale of approximately 1400 m, thereby creating an index of habitat diversity.
Technical Background
Spatial heterogeneity in habitat may, among other things, contribute to increased local species richness (Huston 1994). For macroinvertebrate and fish, increasing habitat heterogeneity in channel width and depth, bed substrate, wood storage, and water velocity conditions increases total species richness (Allan 1995, Matthews 1998). For example, increased channel habitat diversity in the vicinity of tributary fans may create habitat opportunities for specialized aquatic species or for life stages that require low energy environments, including side channels during flood events (e.g., Swales and Levings 1989, Reeves et al. 1998). This has been documented in the Oregon Coast Range where fans at low-order confluences were associated with increased salmonid rearing in pools formed from increased wood storage (Everest and Meehan 1981, Bigelow et al. 2007) and in the Olympic Mountains where large wood, large pools, and gravel deposits were statistically correlated with debris fans (Benda et al. 2003a). Likewise, for riparian communities, greater topographic variation in floodplains and terraces will create local variation in inundation and soil moisture regimes that increase plant diversity (e.g., Kalliola and Puharta 1988, Pollock et al. 1998). This process was documented upstream of alluvial fans following post fire erosion in Idaho (e.g., Benda et al. 2003).
Understanding the variation in habitat diversity within river networks has important implications for natural resource management. Areas of the highest diversity may represent areas in need of greater protection since they may have higher species diversity. In contrast, areas of higher physical diversity (and higher species diversity) may have a greater resistance to certain types of disturbance (i.e., not all habitats will respond the same to a given type and magnitude of disturbance).
|